
See also:
ノート
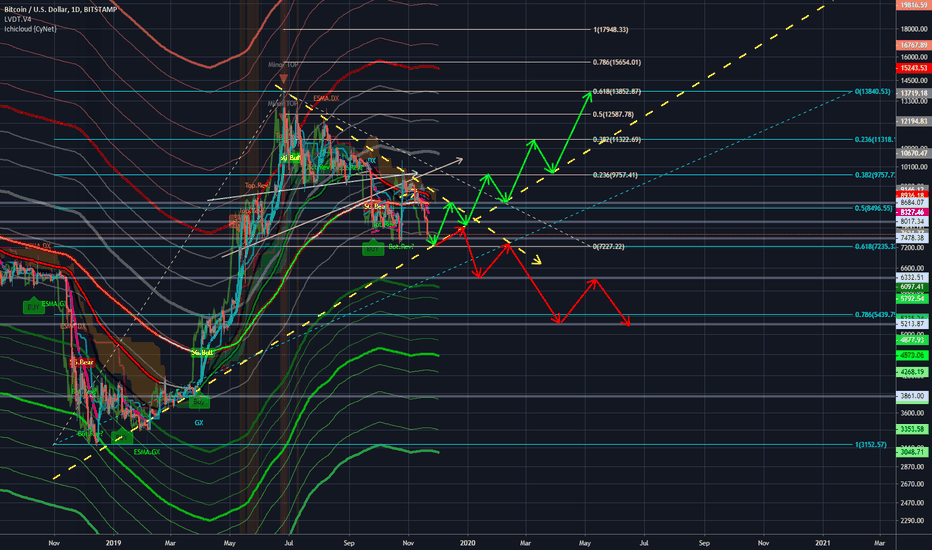
Zoomed out view of how the trendlines were drawn:
ノート
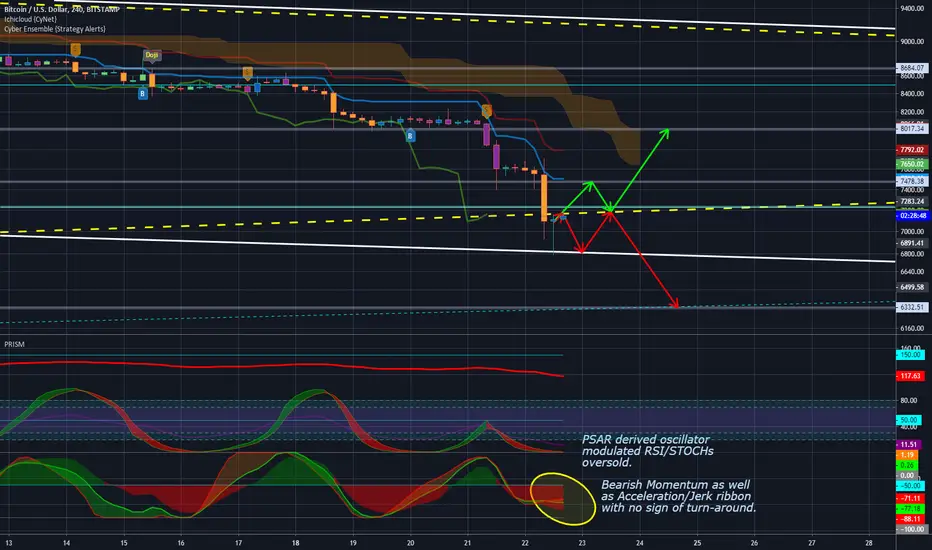
Looking at whether the next 1D candle (or next few lower timeframe candles) gets rejected by the trendline, or is able to break up and hold support...for each scenario to play out, etc.ノート
Grey horizontal lines are VPVR levels.ノート
Also, lower low confirmed -- hence higher likelihood to go down.ノート
Price struggles with overcoming the yellow resistance level and is getting rejected. If this continues with the next 2 hourly candles, will be waiting to potentially buy in at around $6.3kUSD.ノート
Bearish M-Pattern forming; viewed on the 30mins chart:Waiting for BTC to gain more bearish sentiments and more shorts.
ノート
... before a possible bounce..tradingview.com/chart/6HNn0TjD/
ノート
ノート
However, latest chart has price now breaking above resistance! .. But will it continue to find support above?ノート
Price seems to have found support above yellow trend line, and positions itself back within the range set by the yellow triangle..ノート
Support failed!ノート
BTC retested gray resistance line and broken above instead, and with that, is now back into the yellow symm triangle.Will it retest the lower yellow line as support to confirm a bullish move ahead?

免責事項
これらの情報および投稿は、TradingViewが提供または承認する金融、投資、取引、またはその他の種類の助言もしくは推奨であることを意図したものではなく、またこれらに該当するものでもありません。詳細は利用規約をご覧ください。
免責事項
これらの情報および投稿は、TradingViewが提供または承認する金融、投資、取引、またはその他の種類の助言もしくは推奨であることを意図したものではなく、またこれらに該当するものでもありません。詳細は利用規約をご覧ください。