In my previous  BTC analysis I talked about we still haven't entered a disbelief stage.
I used Elliot wave to explain how we completed a 5 wave structure, as well as A and B corrective waves.
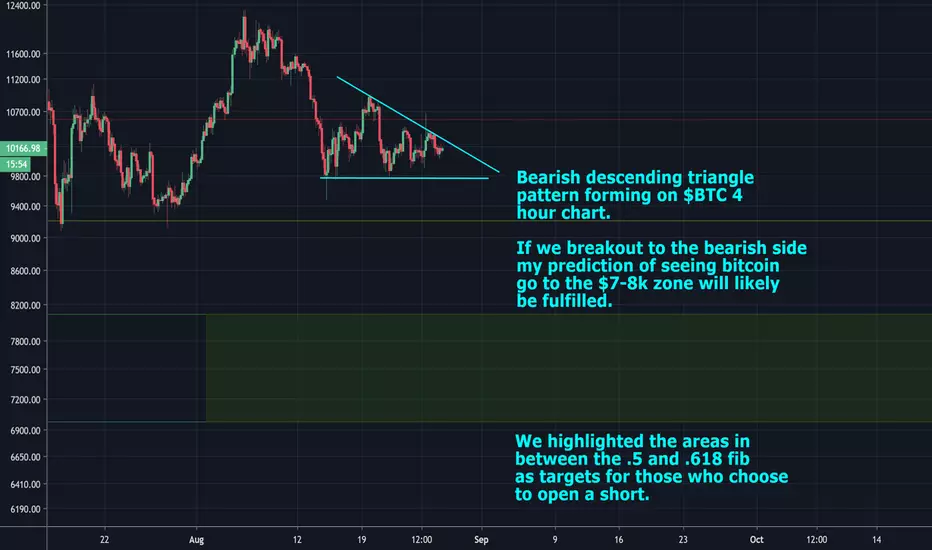
The descending triangle that we can see in the chart above confirms my beliefs even more, if we break out to the downside (which is what this pattern signifies as being likely) we should see a push to the $7-8k zone which is right in between the .5 and .618 fibs.
If we hold there I'd see that as bullish.
BTC analysis I talked about we still haven't entered a disbelief stage. I used Elliot wave to explain how we completed a 5 wave structure, as well as A and B corrective waves.
The descending triangle that we can see in the chart above confirms my beliefs even more, if we break out to the downside (which is what this pattern signifies as being likely) we should see a push to the $7-8k zone which is right in between the .5 and .618 fibs.
If we hold there I'd see that as bullish.

関連の投稿
免責事項
これらの情報および投稿は、TradingViewが提供または承認する金融、投資、取引、またはその他の種類の助言もしくは推奨であることを意図したものではなく、またこれらに該当するものでもありません。詳細は利用規約をご覧ください。
免責事項
これらの情報および投稿は、TradingViewが提供または承認する金融、投資、取引、またはその他の種類の助言もしくは推奨であることを意図したものではなく、またこれらに該当するものでもありません。詳細は利用規約をご覧ください。