
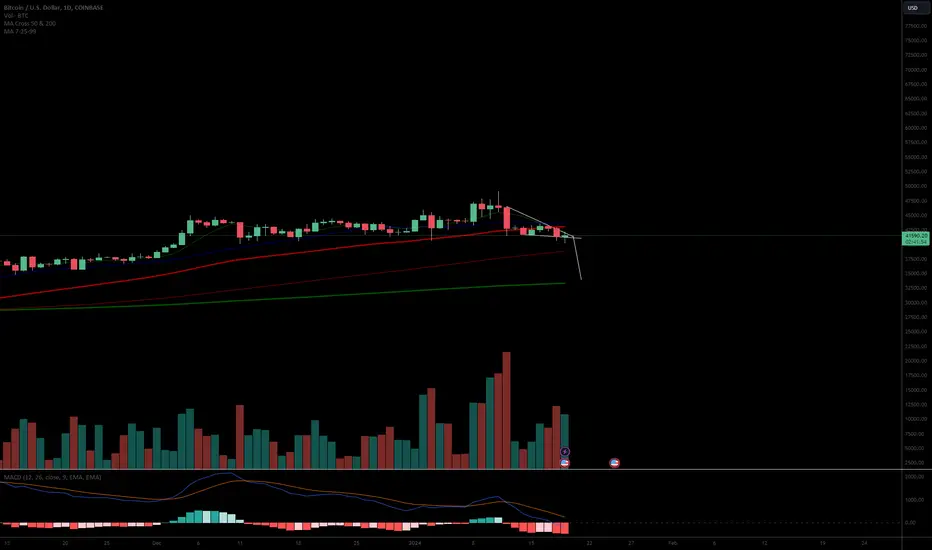
On the Day Chart we have a Descending Triangle Forming. With the Price Target Aligning Well with the 200 Day MA At 33,000. I'd Expect This Being a Quick Correction As We've Had a Golden Cross on the Weekly Which Can take a Couple Weeks to Really Take Effect, So i'm expecting this to be the last down draw
Don't be psyched out this is crypto!
We also have the Moving Average Convergence Divergence Line Where the EMA 9 has Crossed the Signal Line After a Sell Signal Has Been Called
Don't be psyched out this is crypto!
We also have the Moving Average Convergence Divergence Line Where the EMA 9 has Crossed the Signal Line After a Sell Signal Has Been Called

免責事項
これらの情報および投稿は、TradingViewが提供または承認する金融、投資、取引、またはその他の種類の助言もしくは推奨であることを意図したものではなく、またこれらに該当するものでもありません。詳細は利用規約をご覧ください。
免責事項
これらの情報および投稿は、TradingViewが提供または承認する金融、投資、取引、またはその他の種類の助言もしくは推奨であることを意図したものではなく、またこれらに該当するものでもありません。詳細は利用規約をご覧ください。