
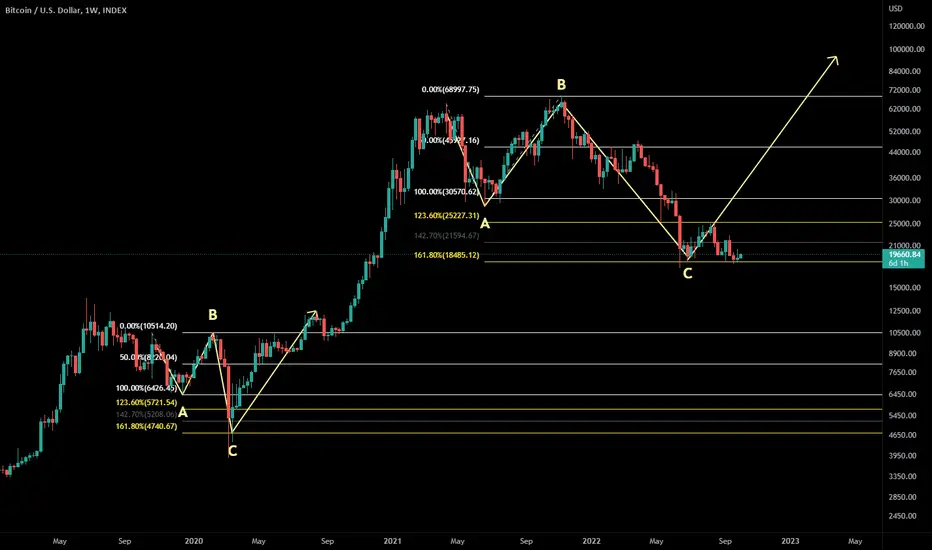
Just a quick post here. I included this as a screenshot in another published chart shown below, but wanted to share this idea by itself.
NOTE -Expanded flat C wave typically stops either at the 1.618 or the 1.236:
- Logarithmic chart has corrected down to the 1.618 exactly.
- Linear chart shows us stopping near the center point between the 1.618 and 1.236, near the 1.427.
Original post:
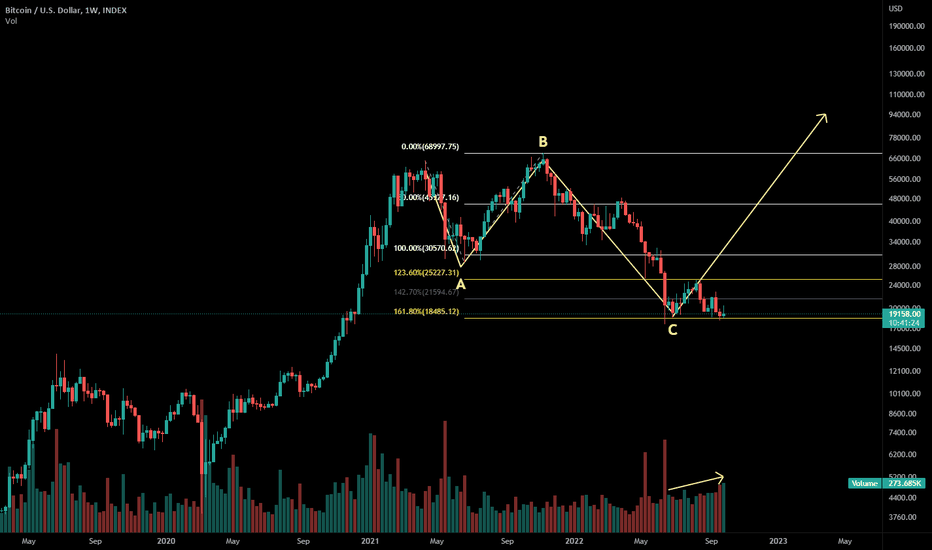
Another note - I'm super bullish on DXY, which should be bearish for crypto and stock markets. For the above move to occur, I'd expect us to see DXY re-test the area around 103.

NOTE -Expanded flat C wave typically stops either at the 1.618 or the 1.236:
- Logarithmic chart has corrected down to the 1.618 exactly.
- Linear chart shows us stopping near the center point between the 1.618 and 1.236, near the 1.427.
Original post:
Another note - I'm super bullish on DXY, which should be bearish for crypto and stock markets. For the above move to occur, I'd expect us to see DXY re-test the area around 103.
ノート
The March 2020 crash/correction linear chart shows it also stopped below the 1.236, but wicked down to or below the 1.618, we haven't yet wicked that low on linear chart.Linear chart fib extension - 2020 pattern:
ノート
Linear chart fib extension - present:ノート
Strong bull divs on 3-day chart:ノート
Back at 1.618, RSI still diverging:ノート
More similarity price vs. RSI:ノート
Quick update - wondering if we might see something like this before we get our impulse up:ノート
3-day chart RSI still showing a strong bull div, but hasn't yet broken out of its downtrend. Presently approaching top of downtrend, a break that gets and stays above ~55-60 would likely be sufficient and lend confluence to the idea of a reversal here. Still some questions: do we see a new price low beforehand, or was RSI low good enough? Will a reversal give us a full recovery / new ATH?
ノート
Dropped below 1.618, weekly bull divs have strengthened:
関連の投稿
免責事項
これらの情報および投稿は、TradingViewが提供または承認する金融、投資、取引、またはその他の種類の助言もしくは推奨であることを意図したものではなく、またこれらに該当するものでもありません。詳細は利用規約をご覧ください。
免責事項
これらの情報および投稿は、TradingViewが提供または承認する金融、投資、取引、またはその他の種類の助言もしくは推奨であることを意図したものではなく、またこれらに該当するものでもありません。詳細は利用規約をご覧ください。