
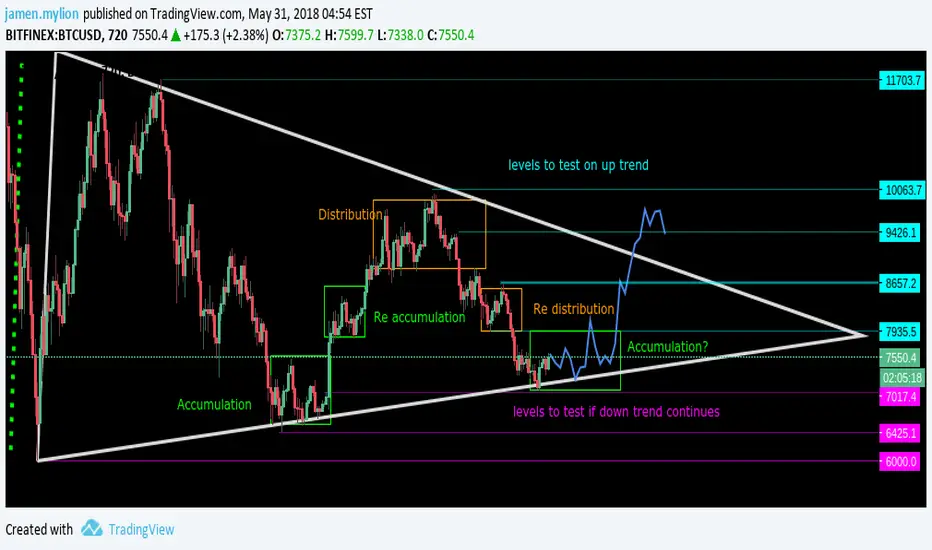
HI guys, So on the 12h you can see that we are in a symmetrical triangle , hopefully we accumulate in this area, and make a move up and break out, the rsi on the 12h indicates bullish divergence in play ,which will lead to a medium scale bull run,. usually triangle breakout target's are based on the base of the triangle , the question is are we going to accumulate here or just have a minor correction and break down .
Bullish target: 13.5k
Bearish target 1.3k ( these are long term targets ,and ,targets should be measured from where they break out from the triangle)
babypips.com/learn/forex/triangles.
We are still in a bear market, becarefull of misleading signals , wait for clear indications.
stockcharts.com/school/doku.php?id=chart_school:market_analysis:the_wyckoff_method
ccn.com/marketcap/- keep an eye on market caps and sentimental news, for it can effect technical analysis ,vice versa
Bullish target: 13.5k
Bearish target 1.3k ( these are long term targets ,and ,targets should be measured from where they break out from the triangle)
babypips.com/learn/forex/triangles.
We are still in a bear market, becarefull of misleading signals , wait for clear indications.
stockcharts.com/school/doku.php?id=chart_school:market_analysis:the_wyckoff_method
ccn.com/marketcap/- keep an eye on market caps and sentimental news, for it can effect technical analysis ,vice versa

免責事項
これらの情報および投稿は、TradingViewが提供または承認する金融、投資、取引、またはその他の種類の助言もしくは推奨であることを意図したものではなく、またこれらに該当するものでもありません。詳細は利用規約をご覧ください。
免責事項
これらの情報および投稿は、TradingViewが提供または承認する金融、投資、取引、またはその他の種類の助言もしくは推奨であることを意図したものではなく、またこれらに該当するものでもありません。詳細は利用規約をご覧ください。