
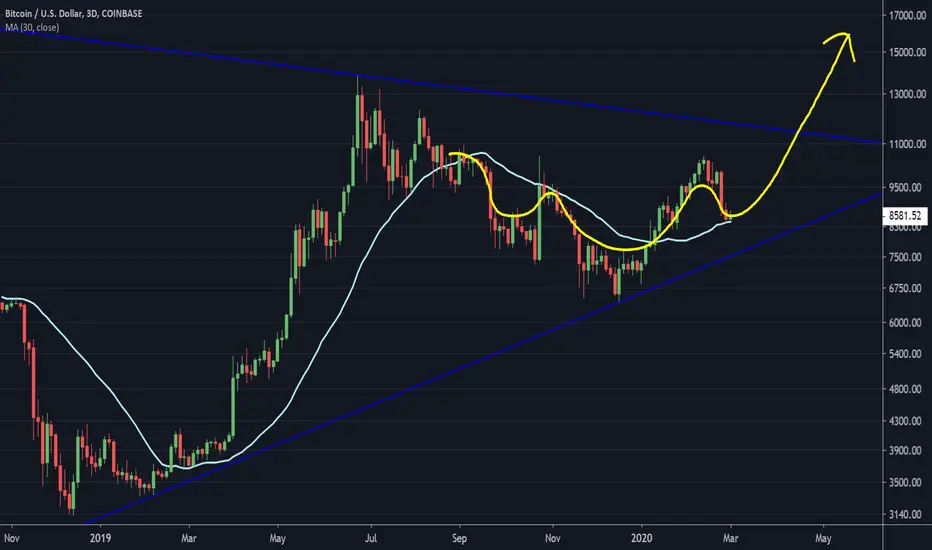
It seems many have gone negative on Bitcoin with the recent plunge of the stock market. I've seen calls for $6K, $5K, Zero, etc. It happens EVERY TIME Bitcoin corrects. On this chart, however, I do see something a bit more positive. This is a 3 Days chart with a 30 bar moving average which is the equivalent of a Daily chart with a 90 day or 3 months moving average. If you follow the yellow line and compare it to the light blue moving average you will see that the price broke below the moving average around last September. Then around November it tested the average from the underside and got rejected falling back to the bottom dark blue trend line. Then in 2020 the price broke OVER the moving average and has just now come back down to test it from the top.
As you can see, if this area around the moving average holds this would be a positive development for Bitcoin. I just wanted to point this out.
You may now return to your previously scheduled FUD programming......
BBS out.
As you can see, if this area around the moving average holds this would be a positive development for Bitcoin. I just wanted to point this out.
You may now return to your previously scheduled FUD programming......
BBS out.
トレード終了: 利益確定目標に到達

免責事項
これらの情報および投稿は、TradingViewが提供または承認する金融、投資、取引、またはその他の種類の助言もしくは推奨であることを意図したものではなく、またこれらに該当するものでもありません。詳細は利用規約をご覧ください。
免責事項
これらの情報および投稿は、TradingViewが提供または承認する金融、投資、取引、またはその他の種類の助言もしくは推奨であることを意図したものではなく、またこれらに該当するものでもありません。詳細は利用規約をご覧ください。