
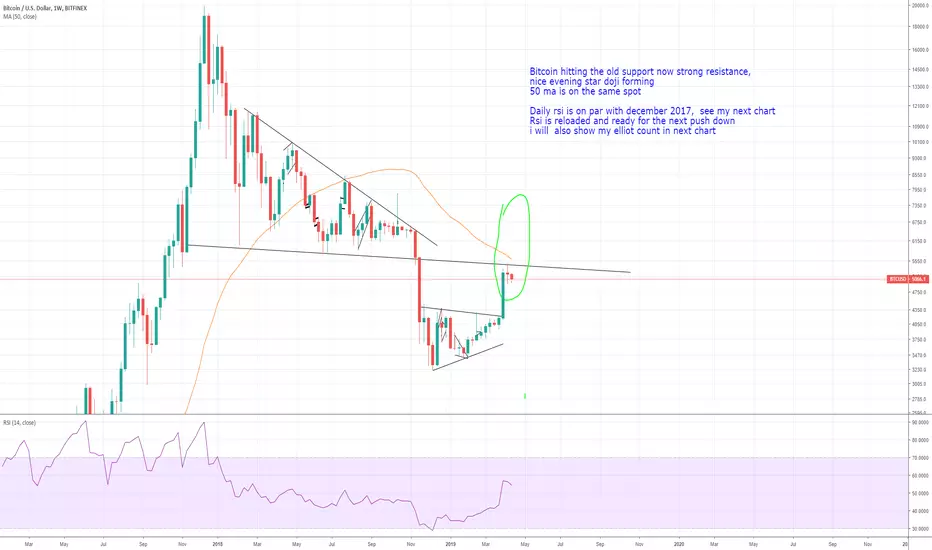
Looking @ the weekly chart of bitcoin we can see that we hit the trendline (old support) and just above there is the 50 ma. This would take a lot of power to break.
But looking @ the daily rsi which is on par with dec 2017 and the evening doji star forming on the weekly i dont see how bitcoin will brake this area now
my primairy elliot count:

Better be careull....
But looking @ the daily rsi which is on par with dec 2017 and the evening doji star forming on the weekly i dont see how bitcoin will brake this area now
my primairy elliot count:
Better be careull....

免責事項
これらの情報および投稿は、TradingViewが提供または承認する金融、投資、取引、またはその他の種類の助言もしくは推奨であることを意図したものではなく、またこれらに該当するものでもありません。詳細は利用規約をご覧ください。
免責事項
これらの情報および投稿は、TradingViewが提供または承認する金融、投資、取引、またはその他の種類の助言もしくは推奨であることを意図したものではなく、またこれらに該当するものでもありません。詳細は利用規約をご覧ください。