
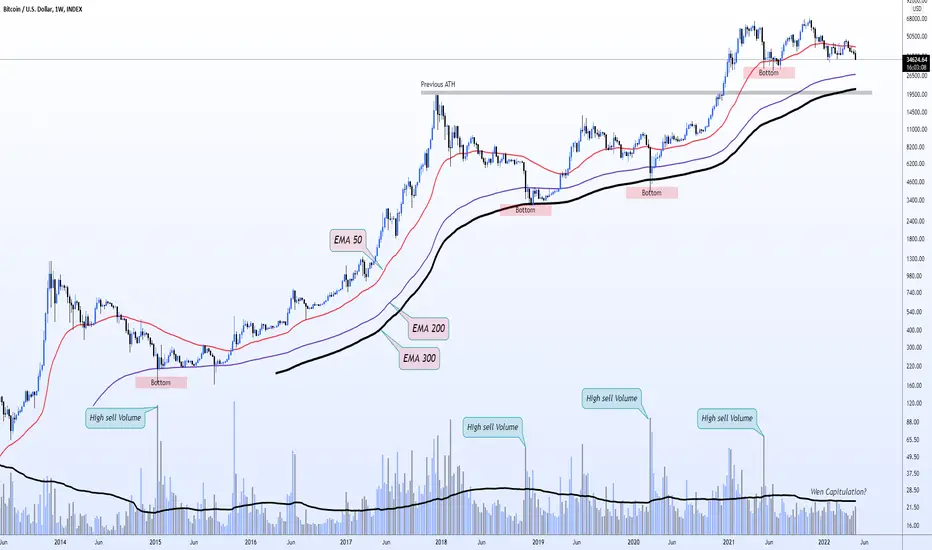
Bitcoin / Weekly / Log Chart
Bitcoin is supported by the 50,200,300 EMA Lines for the past many years. Whenever BTC Bottoms, We see a huge capitulation candle with high sell volume. This means many bulls gave up and they sold all their Bitcoins at the bottom. Later, We saw recovery and saw new ATHs From there.
Currently, We last saw a Capitulation at 29k Last year.
Now since BTC Lost the 50EMA, The price is slowly getting gravitated towards the 200EMA. if we break 29k, Our next support will be 27k. And the worst case will be 20k.
If in case if i see a capitulation candle when we slowly go downwards, That will be the point where i will buy multiple coins heavily.

免責事項
これらの情報および投稿は、TradingViewが提供または承認する金融、投資、取引、またはその他の種類の助言もしくは推奨であることを意図したものではなく、またこれらに該当するものでもありません。詳細は利用規約をご覧ください。
免責事項
これらの情報および投稿は、TradingViewが提供または承認する金融、投資、取引、またはその他の種類の助言もしくは推奨であることを意図したものではなく、またこれらに該当するものでもありません。詳細は利用規約をご覧ください。