
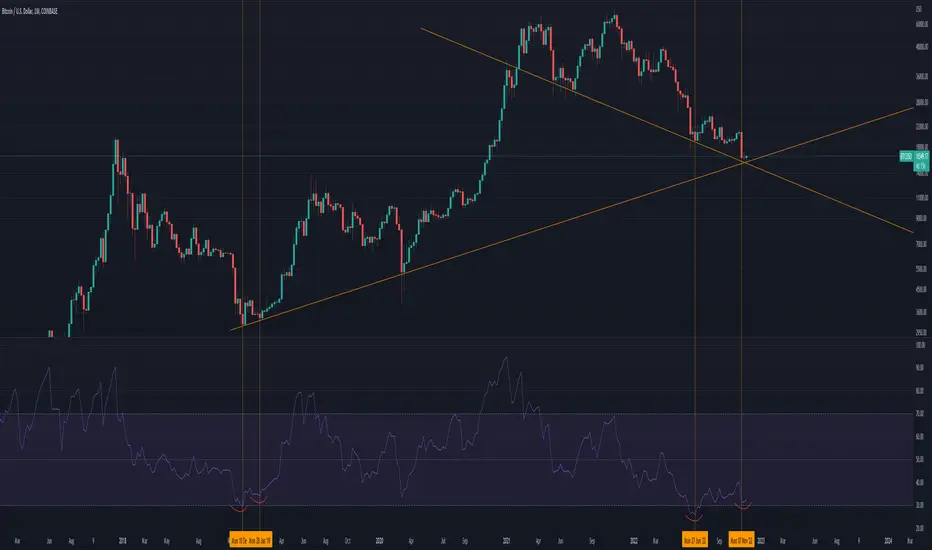
Just a small update on Bitcoin , the price has infact made new lows but the RSI has not and this is very bullish.
When we get these sort of divergences when the RSI is around 30 it is our signal that we are close or at a bottom.
I layed a ray line from the bottom of the weekly close in 2018 and aligned it with he bottom of the March 2020 ,which then gives us this diagonal support line. I hate diagonal support lines they fail most of the time and there many ways one can draw these lines but in this case using the bottom of the weekly closes we get one angle.
So far this support line has had incredible confluence take a look below.
1h Chart

4h Chart

The reaction to this line coming in from last two major bottoms is amazing , there is a high chance that the bottom is in here.
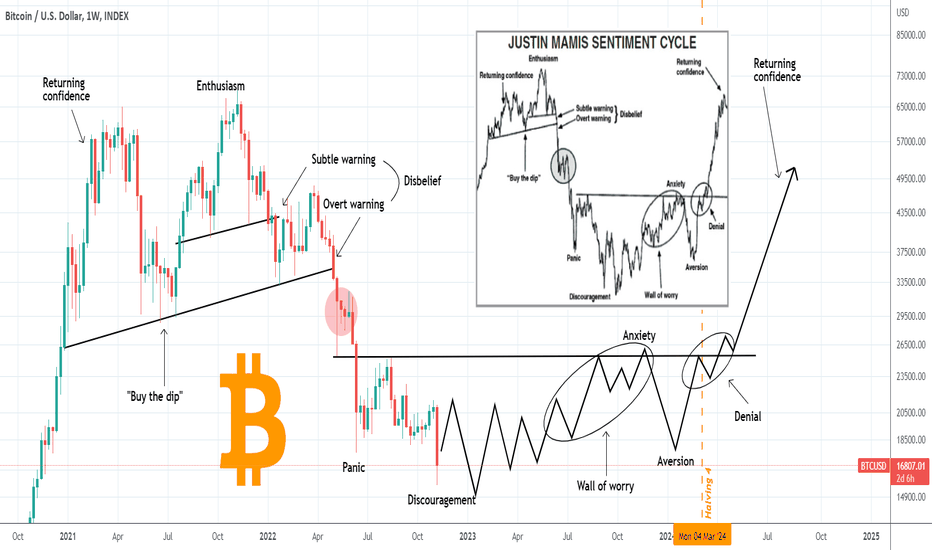
I would also recommend checking out this TA from trading shots it is possible that have completed the final stage with "discouragement" by making that lower low.

When we get these sort of divergences when the RSI is around 30 it is our signal that we are close or at a bottom.
I layed a ray line from the bottom of the weekly close in 2018 and aligned it with he bottom of the March 2020 ,which then gives us this diagonal support line. I hate diagonal support lines they fail most of the time and there many ways one can draw these lines but in this case using the bottom of the weekly closes we get one angle.
So far this support line has had incredible confluence take a look below.
1h Chart
4h Chart
The reaction to this line coming in from last two major bottoms is amazing , there is a high chance that the bottom is in here.
I would also recommend checking out this TA from trading shots it is possible that have completed the final stage with "discouragement" by making that lower low.

免責事項
これらの情報および投稿は、TradingViewが提供または承認する金融、投資、取引、またはその他の種類の助言もしくは推奨であることを意図したものではなく、またこれらに該当するものでもありません。詳細は利用規約をご覧ください。
免責事項
これらの情報および投稿は、TradingViewが提供または承認する金融、投資、取引、またはその他の種類の助言もしくは推奨であることを意図したものではなく、またこれらに該当するものでもありません。詳細は利用規約をご覧ください。