
Bitcoin technical analysis update (Weekly Chart)
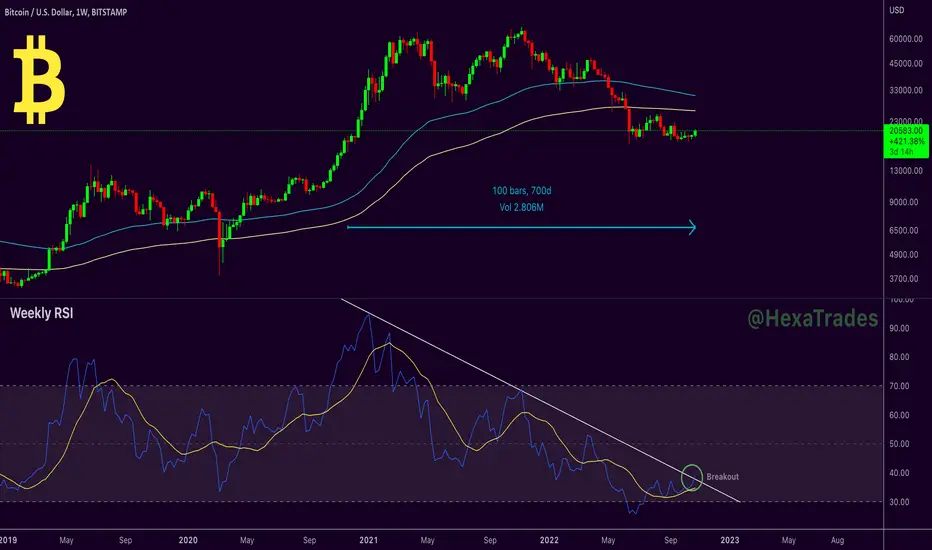
Bitcoin's weekly RSI falling from the last 2 years, In December 2020 weekly RSI touched 95 overbought levels, at the time BTC was trading at $42000 after that RSI started falling.
In the above chart, you can see Bitcoin 2 year-long Weekly RSI breakout above its trend resistance line, this is a good bullish sign for bitcoin.
Thanks
Hexa
Bitcoin's weekly RSI falling from the last 2 years, In December 2020 weekly RSI touched 95 overbought levels, at the time BTC was trading at $42000 after that RSI started falling.
In the above chart, you can see Bitcoin 2 year-long Weekly RSI breakout above its trend resistance line, this is a good bullish sign for bitcoin.
Thanks
Hexa
ノート
Chart Update
🚀Telegram : t.me/hexatrades
🌐Website: hexatrades.io/
🗣️Twitter(X): twitter.com/HexaTrades
🌐Website: hexatrades.io/
🗣️Twitter(X): twitter.com/HexaTrades
関連の投稿
免責事項
これらの情報および投稿は、TradingViewが提供または承認する金融、投資、取引、またはその他の種類の助言もしくは推奨であることを意図したものではなく、またこれらに該当するものでもありません。詳細は利用規約をご覧ください。
🚀Telegram : t.me/hexatrades
🌐Website: hexatrades.io/
🗣️Twitter(X): twitter.com/HexaTrades
🌐Website: hexatrades.io/
🗣️Twitter(X): twitter.com/HexaTrades
関連の投稿
免責事項
これらの情報および投稿は、TradingViewが提供または承認する金融、投資、取引、またはその他の種類の助言もしくは推奨であることを意図したものではなく、またこれらに該当するものでもありません。詳細は利用規約をご覧ください。