
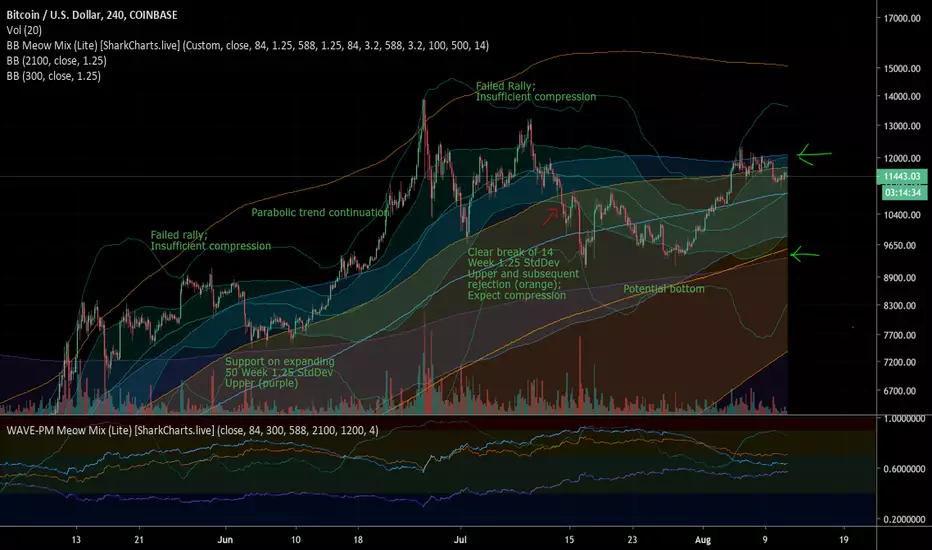
I have spent a lot of time studying past price action in relation to some benchmark periods, specifically 14 day, 50 day, 14 week, and 50 week. I have them loaded up on a 4H chart with BBs and Wave-PM. Past bull runs seem to respect almost perfectly the expanding 50 week 1.25 stddev distribution (PURPLE) as the bottom level of the upward trend on a macro level. It is nicely compressed and beginning an expansion, so I am looking at that as a level to determine macro trend. Here is the chart. Currently I think if we have support at the 14 day MA(GREENISH)/50 day MA(BLUE) confluence level and subsequently a break above the 14 day and 50 day upper 1.25, then parabolic upward trend will likely continue. Alternatively, a break below that will almost certainly see support at that major 50 week 1.25 upper band level.
ノート
Mark Whistler - Volatility IlluminatedSharkCharts.live/Shark Charts discord/ DadShark and acatwithchrts
NO AFFILIATION

免責事項
これらの情報および投稿は、TradingViewが提供または承認する金融、投資、取引、またはその他の種類の助言もしくは推奨であることを意図したものではなく、またこれらに該当するものでもありません。詳細は利用規約をご覧ください。
免責事項
これらの情報および投稿は、TradingViewが提供または承認する金融、投資、取引、またはその他の種類の助言もしくは推奨であることを意図したものではなく、またこれらに該当するものでもありません。詳細は利用規約をご覧ください。