
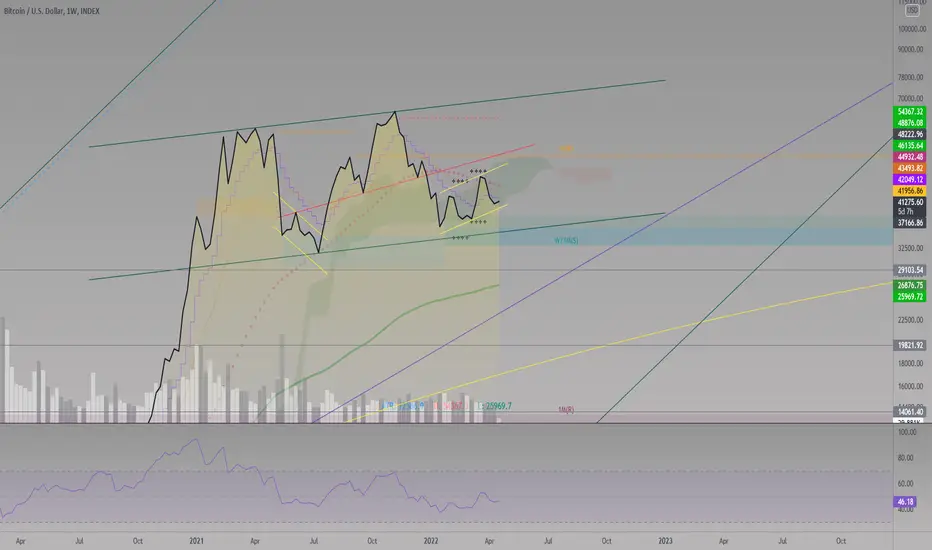
A weekly chart on BTCUSD filtering out the noise. Clearly you can see the difference between first touch and bull flag (descending channel) followed by breakout to test ATH before touching 33k and now forming bear flag (ascending channel). This is a sign of upcoming downwave in BTC in the upcoming months if the price action breaks out of the channel downwards. Long story short, filter out the noise and pay attention to the charts.
Disclaimer: An educational idea only. Not a financial advise. I hold no personal positions in BTC
Disclaimer: An educational idea only. Not a financial advise. I hold no personal positions in BTC
トレード稼働中
Breaking out of the uptrending channel is happening. Look for a weekly close below 39000$ for confirmation of the breakoutトレード稼働中
We are now out of the bear flag and falling towards the final support of the uptrending green channel around 36000$. After this, next stop at 29000$, followed by 20000 $ eventually.
トレード終了: 利益確定目標に到達
Target reached.
免責事項
これらの情報および投稿は、TradingViewが提供または承認する金融、投資、取引、またはその他の種類の助言もしくは推奨であることを意図したものではなく、またこれらに該当するものでもありません。詳細は利用規約をご覧ください。
免責事項
これらの情報および投稿は、TradingViewが提供または承認する金融、投資、取引、またはその他の種類の助言もしくは推奨であることを意図したものではなく、またこれらに該当するものでもありません。詳細は利用規約をご覧ください。