
I am an amateur technical analyst. This is not financial advice. You should always do your own research. Consider this post as entertainment. I'm simply sharing what I see in the charts and always welcome collaboration and feedback.
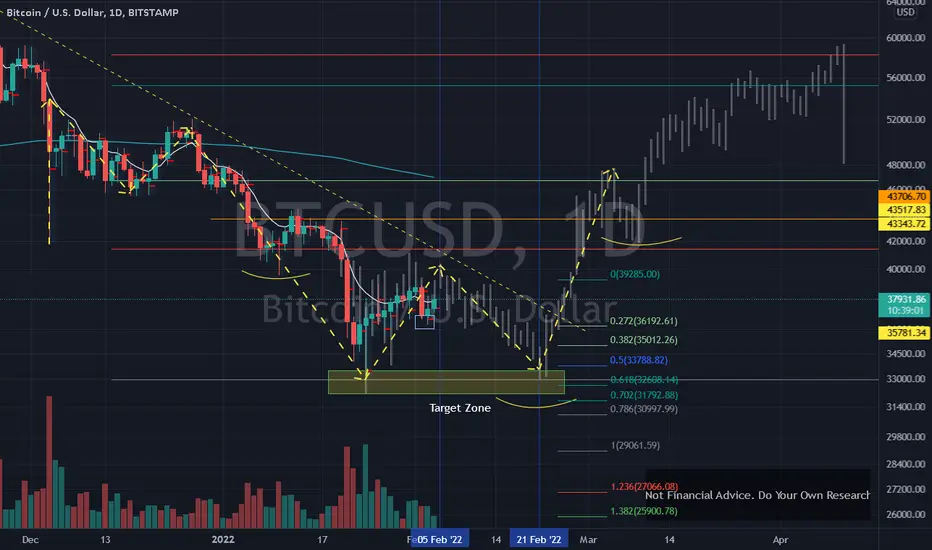
Updating my previous post of Feb 3rd. BTCUSD stayed within the fractal and yesterday went the full depth of the fractal bar. So far, the fractal remains intact as the market continues to work within the pattern of the May '21 fractal.
Based on the fractal pattern, today and tomorrow should be up days. There's a possibility that we reach as high as 41,250, which is the upper trend line above the pattern, and would be slightly above tomorrow's daily bar. After tomorrow, the pattern indicates a gradual decline until Feb 21st. Feb 21st then offers the opportunity for a reversal and potentially the launch pad for ALT season.
Updating my previous post of Feb 3rd. BTCUSD stayed within the fractal and yesterday went the full depth of the fractal bar. So far, the fractal remains intact as the market continues to work within the pattern of the May '21 fractal.
Based on the fractal pattern, today and tomorrow should be up days. There's a possibility that we reach as high as 41,250, which is the upper trend line above the pattern, and would be slightly above tomorrow's daily bar. After tomorrow, the pattern indicates a gradual decline until Feb 21st. Feb 21st then offers the opportunity for a reversal and potentially the launch pad for ALT season.
ノート
If May '21 fractal outperforms tomorrow as well, I'm looking for BTC to tap .236 fib at 41,457.8. If we keep running up after Saturday, then I'll be putting aside May '21 fractal and watching Sep '17 fractal, which takes BTC to new ATH.
関連の投稿
免責事項
これらの情報および投稿は、TradingViewが提供または承認する金融、投資、取引、またはその他の種類の助言もしくは推奨であることを意図したものではなく、またこれらに該当するものでもありません。詳細は利用規約をご覧ください。
免責事項
これらの情報および投稿は、TradingViewが提供または承認する金融、投資、取引、またはその他の種類の助言もしくは推奨であることを意図したものではなく、またこれらに該当するものでもありません。詳細は利用規約をご覧ください。