
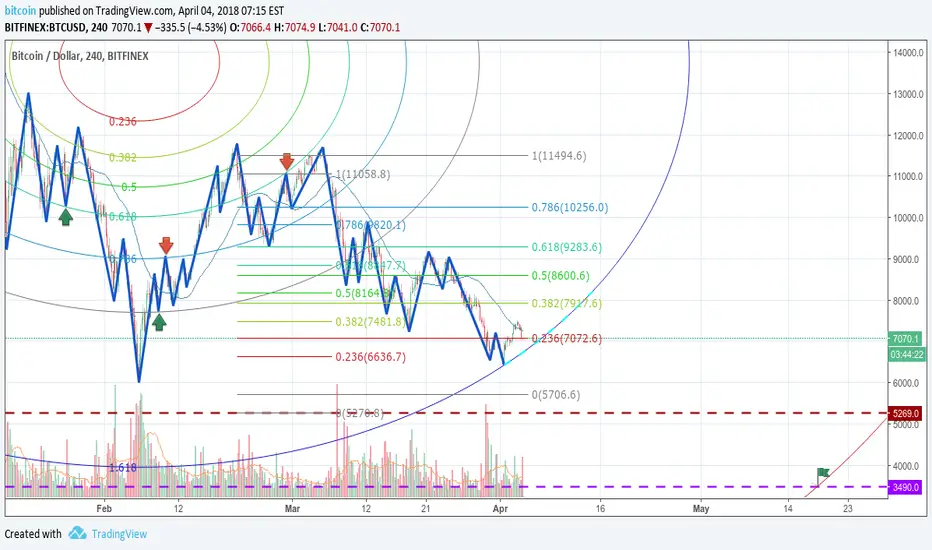
This is a series of studies to try and simulate Bears setups. There is a lot of scenarios, and this methodology is still empirical. So I still don't have magic perfect crystal balls predictions but this is not the target, my target is always to have a base for risk management. To calculate high ratios risk rewards. This is attempt 1, ONLY for a bear market ! This simulation put into conflict the possible end of bear market with 1.618 Circle Fib into the last previous low, if it ever breaks down them this is the fastest confirmation you get that bears market is still ON.
ノート
Btc is testing the dashed curved supportノート
Looks like the dashed support is not perfectly accurate but overall it is there with minor adjustments
関連の投稿
免責事項
これらの情報および投稿は、TradingViewが提供または承認する金融、投資、取引、またはその他の種類の助言もしくは推奨であることを意図したものではなく、またこれらに該当するものでもありません。詳細は利用規約をご覧ください。
免責事項
これらの情報および投稿は、TradingViewが提供または承認する金融、投資、取引、またはその他の種類の助言もしくは推奨であることを意図したものではなく、またこれらに該当するものでもありません。詳細は利用規約をご覧ください。