
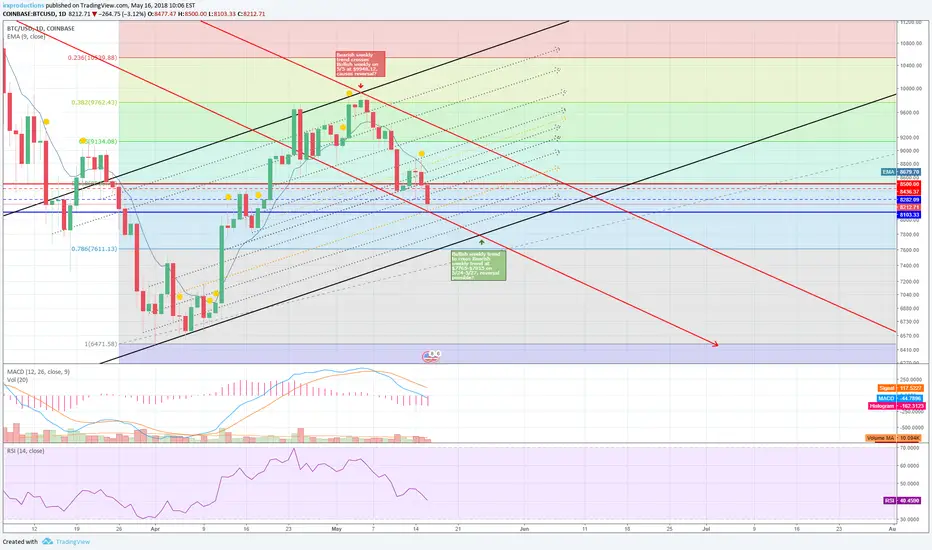
Looking at Bitcoin in the long-term using weekly trend lines, the recent Bearish reversal happened on 5/5 at a high of $9948.12 when a Bearish weekly trend (upper solid red) crossed with a Bullish weekly trend (upper black red).
Taking the theory to the next step, a lower Bearish weekly trend line (lower solid red) may cross with a lower Bullish weekly trend (lower solid black) between 5/24-5/27 at a rough price estimate of $7,765-$7,815.
Could this cause another reversal?
I'm still incredibly green at crypto Technical Analysis, so I'm hoping for to hear suggestions, ideas, and errors I may be making. Thanks, everyone!
Taking the theory to the next step, a lower Bearish weekly trend line (lower solid red) may cross with a lower Bullish weekly trend (lower solid black) between 5/24-5/27 at a rough price estimate of $7,765-$7,815.
Could this cause another reversal?
I'm still incredibly green at crypto Technical Analysis, so I'm hoping for to hear suggestions, ideas, and errors I may be making. Thanks, everyone!

免責事項
これらの情報および投稿は、TradingViewが提供または承認する金融、投資、取引、またはその他の種類の助言もしくは推奨であることを意図したものではなく、またこれらに該当するものでもありません。詳細は利用規約をご覧ください。
免責事項
これらの情報および投稿は、TradingViewが提供または承認する金融、投資、取引、またはその他の種類の助言もしくは推奨であることを意図したものではなく、またこれらに該当するものでもありません。詳細は利用規約をご覧ください。