
Hello Traders,
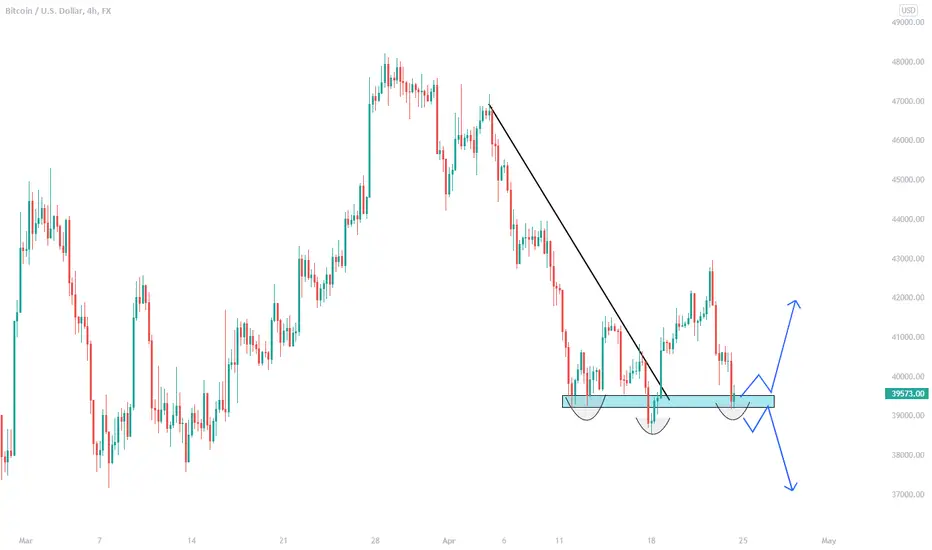
Bitcoin is currently at support level that has yet to be broken. It may be forming an Inverse Head and Shoulders Chart pattern to continue to the buyside to break back above $40k
If the scenario does occurs where Bitcoin breaks under support, then we can wait for the retest to continue to the sell side
If you are unfamiliar with the "Head and Shoulder" chart pattern, please refer to the related ideas section below
Bitcoin is currently at support level that has yet to be broken. It may be forming an Inverse Head and Shoulders Chart pattern to continue to the buyside to break back above $40k
If the scenario does occurs where Bitcoin breaks under support, then we can wait for the retest to continue to the sell side
If you are unfamiliar with the "Head and Shoulder" chart pattern, please refer to the related ideas section below

関連の投稿
免責事項
これらの情報および投稿は、TradingViewが提供または承認する金融、投資、取引、またはその他の種類の助言もしくは推奨であることを意図したものではなく、またこれらに該当するものでもありません。詳細は利用規約をご覧ください。
免責事項
これらの情報および投稿は、TradingViewが提供または承認する金融、投資、取引、またはその他の種類の助言もしくは推奨であることを意図したものではなく、またこれらに該当するものでもありません。詳細は利用規約をご覧ください。