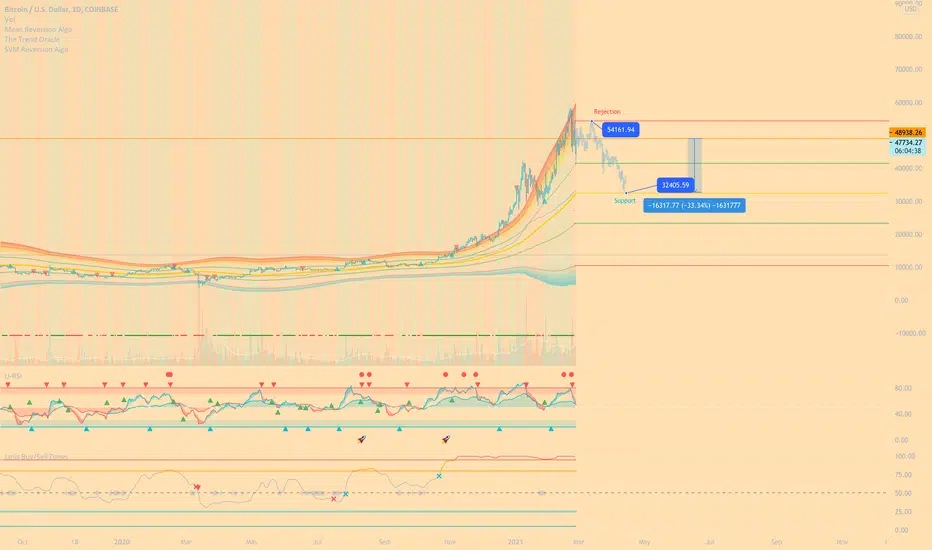
I've been running several algo's (only super_simplified versions here on TV) at the same time attempting to compute Probability distributions (DL based on SVM) of a mean reversion for  BTCUSDat this level, and using Convolutional neural networks, to map current price action patterns with historic chart patterns across multiple sectors.
Here's the Alpha:
According to my model we should see a retest of the 54k-55k level before rejecting and correcting down to the mid 30k's.
Note: Probability theory is just PROBABILITY. Nothing is for sure. Human emotions are too random to accurately predict.
:)
MM
BTCUSDat this level, and using Convolutional neural networks, to map current price action patterns with historic chart patterns across multiple sectors.Here's the Alpha:
According to my model we should see a retest of the 54k-55k level before rejecting and correcting down to the mid 30k's.
Note: Probability theory is just PROBABILITY. Nothing is for sure. Human emotions are too random to accurately predict.
:)
MM

免責事項
これらの情報および投稿は、TradingViewが提供または承認する金融、投資、取引、またはその他の種類の助言もしくは推奨であることを意図したものではなく、またこれらに該当するものでもありません。詳細は利用規約をご覧ください。
免責事項
これらの情報および投稿は、TradingViewが提供または承認する金融、投資、取引、またはその他の種類の助言もしくは推奨であることを意図したものではなく、またこれらに該当するものでもありません。詳細は利用規約をご覧ください。