
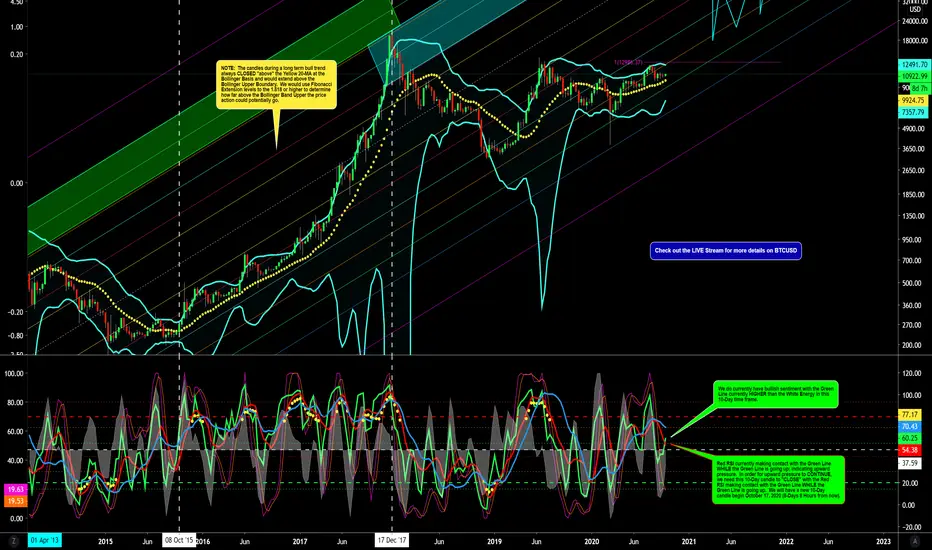
...Current 10-Day Candle CLOSES on October 17, 2020. Have a look at the 10-Day chart again below. The chart above may be scrunched up by TradingView's platform. I will follow up with another chart (5-Day) to add a few more additional comments.

ノート
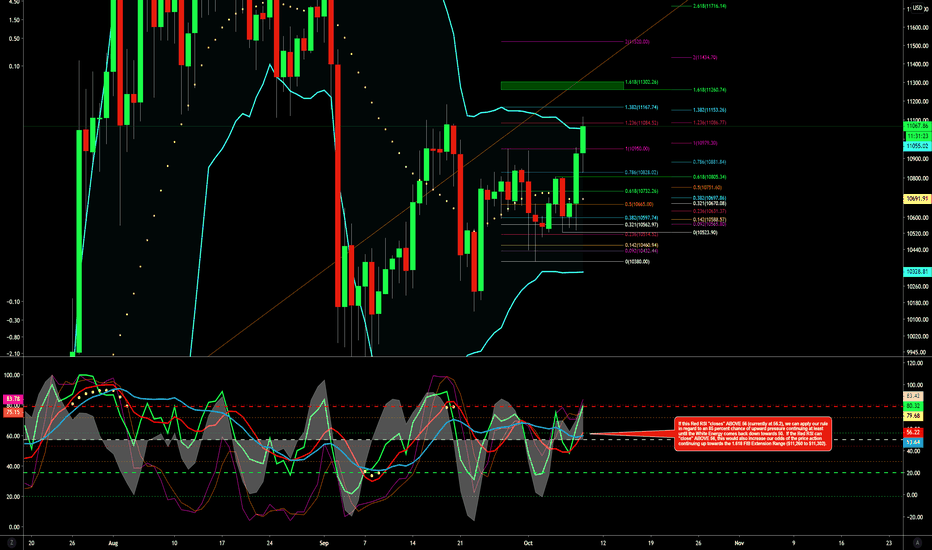
UPDATE:We were currently in a race between the White Energy in the 5-Day and Red RSI in the 10-Day. It's currently looking like the White Energy in the 5-Day will CLOSE above 50 "before" the Red RSI in the 10-Day can CROSS "below" 50. In which case, this is a signal for downward pressure likely coming to a close and transitioning to upward pressure. TO CONFIRM this transition to sustained upward pressure, we want to see the Green Line go HIGHER than the White Energy in the Daily, 2-Day, 3-Day and 4-Day and REMAIN higher than the Energy for a while.
BELOW is a look at the Green Line and White Energy in the 24 Hour, 3-Day and 5-Day Time Frames:
ノート
UPDATE:90 minute; 3 hour and 6 hour time frames:
ノート
UPDATE:12 hour time frame:
ノート
UPDATE:Additional notes on the Bollinger Bands in the 24h and 3-Day time frames:
ノート
UPDATE:An additional note for the Daily Phoenix 1.119 indicator:
ノート
UPDATE:Let's see where she goes... ; )
ノート

免責事項
これらの情報および投稿は、TradingViewが提供または承認する金融、投資、取引、またはその他の種類の助言もしくは推奨であることを意図したものではなく、またこれらに該当するものでもありません。詳細は利用規約をご覧ください。
免責事項
これらの情報および投稿は、TradingViewが提供または承認する金融、投資、取引、またはその他の種類の助言もしくは推奨であることを意図したものではなく、またこれらに該当するものでもありません。詳細は利用規約をご覧ください。