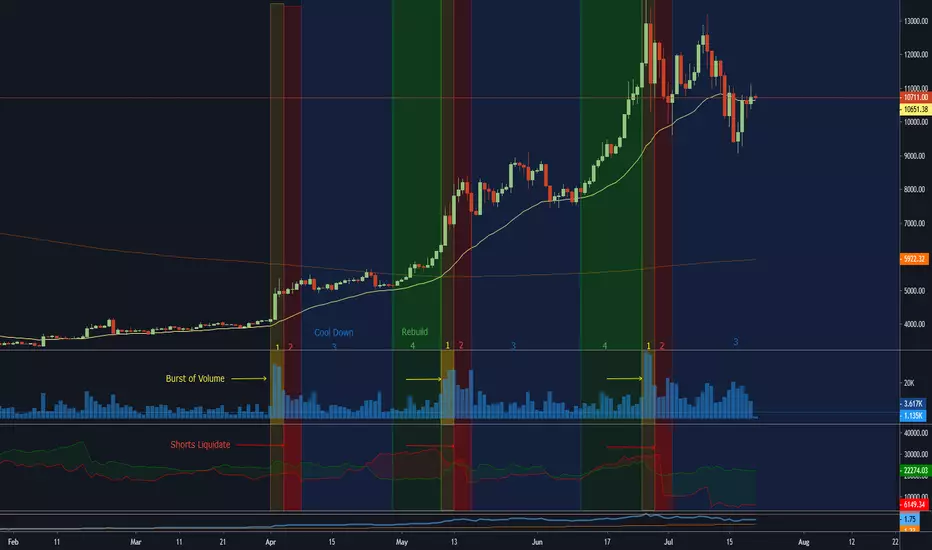
Recently noticed a pattern in the charts.
The third chart is a piece of pine script I wrote to help visualize BTCUSDSHORTS and BTCUSDLONGS.
A drop in open shorts has been preceded by large volume pushing the price higher, likely into many stops, continuing the rally.

As you can see, after the action has cooled down price, will move to the 30 day EMA before it picks up again. Except for this last time. Price plunged under the 30 day EMA before it snapped back to the EMA. Also, the amount of open shorts on Bitfinex is the lowest its been.

This leads me to believe the cool down period will last longer than the previous ones.
The third chart is a piece of pine script I wrote to help visualize
BTCUSDSHORTS and BTCUSDLONGS. A drop in open shorts has been preceded by large volume pushing the price higher, likely into many stops, continuing the rally.
As you can see, after the action has cooled down price, will move to the 30 day EMA before it picks up again. Except for this last time. Price plunged under the 30 day EMA before it snapped back to the EMA. Also, the amount of open shorts on Bitfinex is the lowest its been.
This leads me to believe the cool down period will last longer than the previous ones.

免責事項
これらの情報および投稿は、TradingViewが提供または承認する金融、投資、取引、またはその他の種類の助言もしくは推奨であることを意図したものではなく、またこれらに該当するものでもありません。詳細は利用規約をご覧ください。
免責事項
これらの情報および投稿は、TradingViewが提供または承認する金融、投資、取引、またはその他の種類の助言もしくは推奨であることを意図したものではなく、またこれらに該当するものでもありません。詳細は利用規約をご覧ください。