
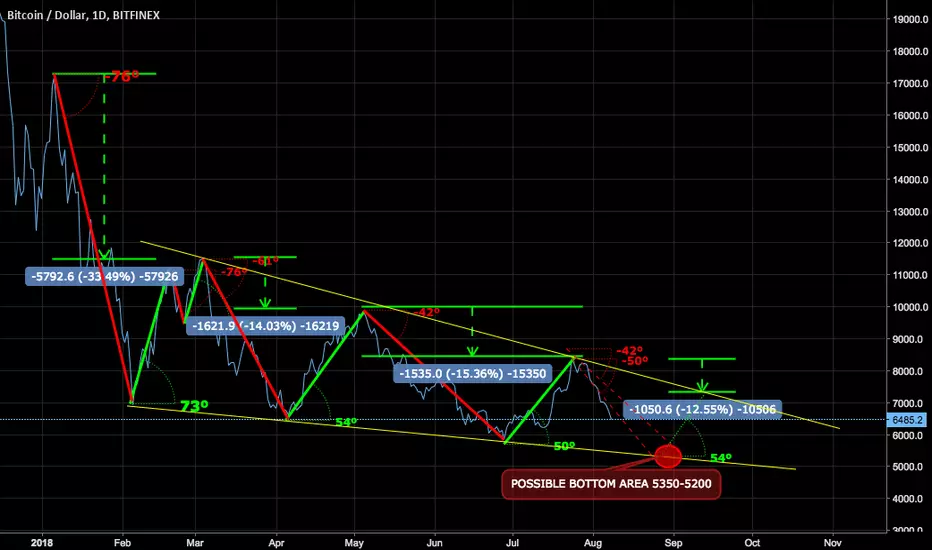
Just playing with angles and potential trend lines. Nothing serious. I don't trade it and I made it only for fun/research purposes. It would be fun if it plays out ;-)
Potential bottom according to this scheme is 5200-5350 on 2018-08-25 to 2018-09-04 and bounce back to 7400.
Potential bottom according to this scheme is 5200-5350 on 2018-08-25 to 2018-09-04 and bounce back to 7400.
トレード稼働中
It looks bad in TV view. Angles are spread wrong. This is proper picture 
関連の投稿
免責事項
これらの情報および投稿は、TradingViewが提供または承認する金融、投資、取引、またはその他の種類の助言もしくは推奨であることを意図したものではなく、またこれらに該当するものでもありません。詳細は利用規約をご覧ください。
免責事項
これらの情報および投稿は、TradingViewが提供または承認する金融、投資、取引、またはその他の種類の助言もしくは推奨であることを意図したものではなく、またこれらに該当するものでもありません。詳細は利用規約をご覧ください。