
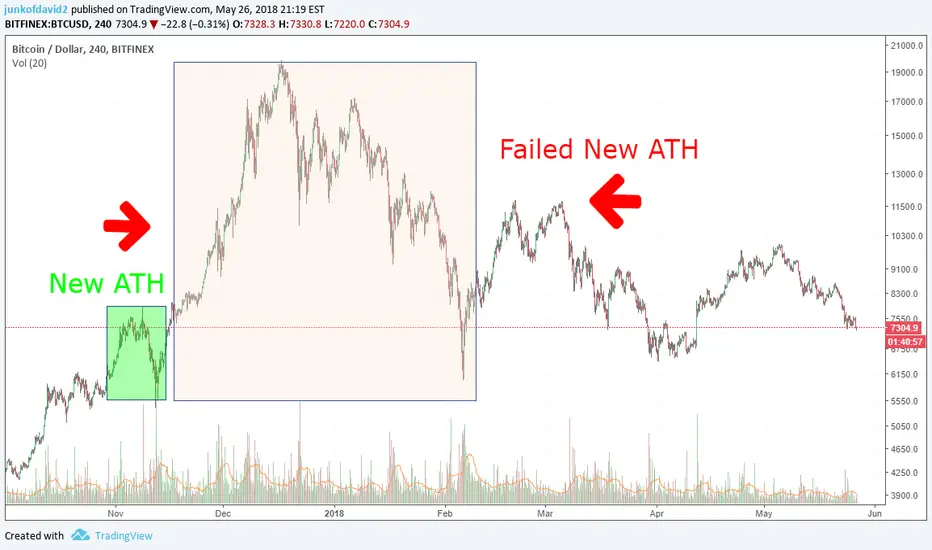
Yesterday I showed similar patterns which may suggest that history might repeat itself. Today I show how it might not be true either, with super similar patterns which ended up in opposite direction.
So you may apply this for both past bullish patterns and past bearish patterns. If you're bullish, you may use this to say that the similarity to 2014's chart doesn't mean we'll have a repeat of that. If you're bearish, you may use this to say that my chart yesterday won't result in a reversal at 5,400.
In any case, it's interesting!
So you may apply this for both past bullish patterns and past bearish patterns. If you're bullish, you may use this to say that the similarity to 2014's chart doesn't mean we'll have a repeat of that. If you're bearish, you may use this to say that my chart yesterday won't result in a reversal at 5,400.
In any case, it's interesting!

関連の投稿
免責事項
これらの情報および投稿は、TradingViewが提供または承認する金融、投資、取引、またはその他の種類の助言もしくは推奨であることを意図したものではなく、またこれらに該当するものでもありません。詳細は利用規約をご覧ください。
免責事項
これらの情報および投稿は、TradingViewが提供または承認する金融、投資、取引、またはその他の種類の助言もしくは推奨であることを意図したものではなく、またこれらに該当するものでもありません。詳細は利用規約をご覧ください。