
This is an update to a previous post attached below.
White traingle
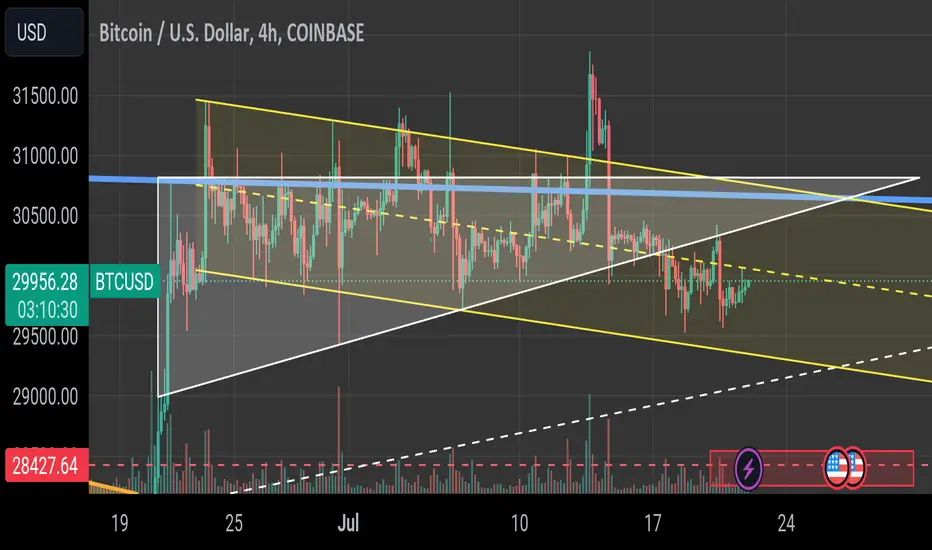
Looking at the white traingle pattern it looks like BTC has broken down, with a confirmed retest. Bearish.
The measure move (target) would be around $28540 as shown by red box.
Yellow Parralel Channel
The channel is playing out nicely so far, you can see it react well on smaller timeframes, especially the central line! Although we broke down from the triangle we have for tbe meantime found some support around the bottom of the channel.
Blue line
The thicker blue line is a longer term support/resistance begining in January 2021. We have yet to break back above it since May 2022, with multiple attempts.
White traingle
Looking at the white traingle pattern it looks like BTC has broken down, with a confirmed retest. Bearish.
The measure move (target) would be around $28540 as shown by red box.
Yellow Parralel Channel
The channel is playing out nicely so far, you can see it react well on smaller timeframes, especially the central line! Although we broke down from the triangle we have for tbe meantime found some support around the bottom of the channel.
Blue line
The thicker blue line is a longer term support/resistance begining in January 2021. We have yet to break back above it since May 2022, with multiple attempts.

関連の投稿
免責事項
これらの情報および投稿は、TradingViewが提供または承認する金融、投資、取引、またはその他の種類の助言もしくは推奨であることを意図したものではなく、またこれらに該当するものでもありません。詳細は利用規約をご覧ください。
免責事項
これらの情報および投稿は、TradingViewが提供または承認する金融、投資、取引、またはその他の種類の助言もしくは推奨であることを意図したものではなく、またこれらに該当するものでもありません。詳細は利用規約をご覧ください。