
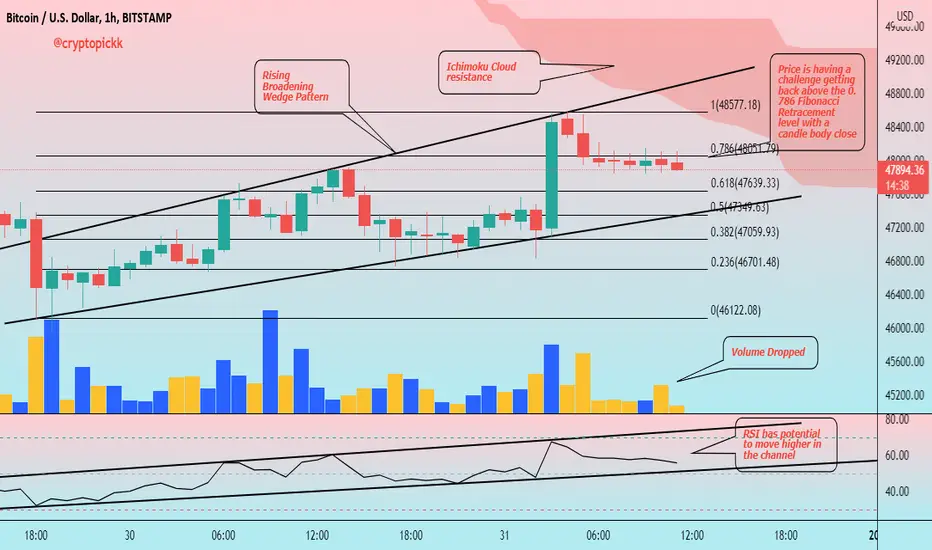
Hello friends, today you can review the technical analysis idea on a 1H linear scale chart for Bitcoin (BTC).
The chart is self-explanatory. The Bitcoin price is moving up the short-term rising broadening wedge pattern (generally bearish) and may be met with the Ichimoku Cloud (red - bearish). The Volume came in earlier today but seems to have dropped. The RSI is moving upwards in a rising channel. The Fibonacci Retracement shows the price hovering in the 0.786 area and having trouble closing a candle body above it for now. Overall the price may have the potential to move higher with the RSI moving higher to the overbought area before a retracement.
In the ideas noted below are a few mid-term and long-term Bitcoin charts. Please review.
If you enjoy my ideas, feel free to like it and drop in a comment. I love reading your comments below.
Disclosure: This is just my opinion and not any type of financial advice. I enjoy charting and discussing technical analysis. Don't trade based on my advice. Do your own research! #cryptopickk
The chart is self-explanatory. The Bitcoin price is moving up the short-term rising broadening wedge pattern (generally bearish) and may be met with the Ichimoku Cloud (red - bearish). The Volume came in earlier today but seems to have dropped. The RSI is moving upwards in a rising channel. The Fibonacci Retracement shows the price hovering in the 0.786 area and having trouble closing a candle body above it for now. Overall the price may have the potential to move higher with the RSI moving higher to the overbought area before a retracement.
In the ideas noted below are a few mid-term and long-term Bitcoin charts. Please review.
If you enjoy my ideas, feel free to like it and drop in a comment. I love reading your comments below.
Disclosure: This is just my opinion and not any type of financial advice. I enjoy charting and discussing technical analysis. Don't trade based on my advice. Do your own research! #cryptopickk
ノート
Bitcoin couldn't break the 0.786 Fib level and got rejected. Price could go for a double bottom pattern.
関連の投稿
免責事項
これらの情報および投稿は、TradingViewが提供または承認する金融、投資、取引、またはその他の種類の助言もしくは推奨であることを意図したものではなく、またこれらに該当するものでもありません。詳細は利用規約をご覧ください。
関連の投稿
免責事項
これらの情報および投稿は、TradingViewが提供または承認する金融、投資、取引、またはその他の種類の助言もしくは推奨であることを意図したものではなく、またこれらに該当するものでもありません。詳細は利用規約をご覧ください。