
Key Observations:
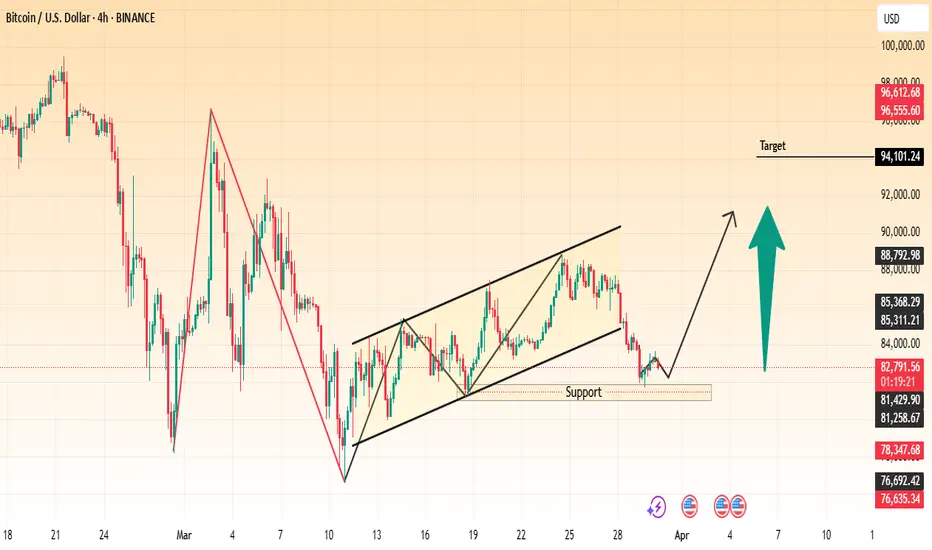
Support Zone: A crucial support level is marked below the broken channel, indicating a potential area for a price reversal.
Bullish Projection: A breakout above this support level could push BTC higher towards the target price of 94,101.24 USD.
Technical Patterns: The price initially showed a strong downtrend, followed by a recovery forming an ascending channel, and now a potential bullish breakout is expected.
Trading Plan:
Bullish Scenario: If BTC holds above the support level, a strong move upwards toward 94,101.24 USD could be expected.
Bearish Scenario: A failure to hold support could result in further downside toward lower key levels.
Conclusion:
Traders might look for buying opportunities near the support zone with a potential upside target of 94,101.24 USD while managing risk in case of further breakdown.
Would you like to refine this further or add specific indicators? 🚀
Support Zone: A crucial support level is marked below the broken channel, indicating a potential area for a price reversal.
Bullish Projection: A breakout above this support level could push BTC higher towards the target price of 94,101.24 USD.
Technical Patterns: The price initially showed a strong downtrend, followed by a recovery forming an ascending channel, and now a potential bullish breakout is expected.
Trading Plan:
Bullish Scenario: If BTC holds above the support level, a strong move upwards toward 94,101.24 USD could be expected.
Bearish Scenario: A failure to hold support could result in further downside toward lower key levels.
Conclusion:
Traders might look for buying opportunities near the support zone with a potential upside target of 94,101.24 USD while managing risk in case of further breakdown.
Would you like to refine this further or add specific indicators? 🚀

免責事項
これらの情報および投稿は、TradingViewが提供または承認する金融、投資、取引、またはその他の種類の助言もしくは推奨であることを意図したものではなく、またこれらに該当するものでもありません。詳細は利用規約をご覧ください。
免責事項
これらの情報および投稿は、TradingViewが提供または承認する金融、投資、取引、またはその他の種類の助言もしくは推奨であることを意図したものではなく、またこれらに該当するものでもありません。詳細は利用規約をご覧ください。