
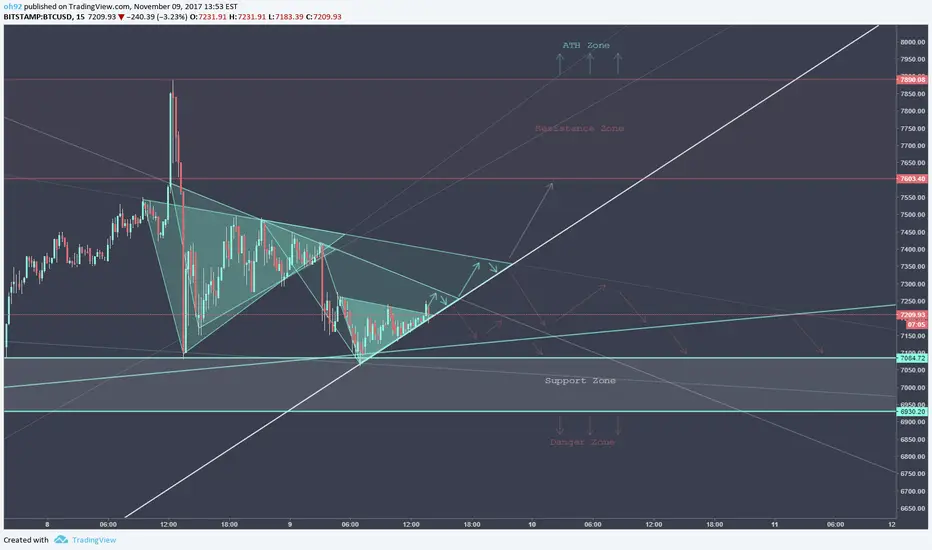
For myself, geometry trading has proven to be my most effective strategy in the arsenal.
To explain the chart above, each trendline represents possible support or resistance.
Therefore, I will remain bullish as long as BTC remains above the solid white trendline.
From that point, this becomes nothing other than a game of ladders. A break in one level generally means that a test of the next is likely.
To make this strategy even more effective, one could even add fib levels for additional support and resistance zones.
I hope this helps and good luck to you all!
DISCLAIMER:
Please note I am only providing my own trading information for your benefit and insight to my trading techniques, you should do your own due diligence and not take this information as a trade signal.
To explain the chart above, each trendline represents possible support or resistance.
Therefore, I will remain bullish as long as BTC remains above the solid white trendline.
From that point, this becomes nothing other than a game of ladders. A break in one level generally means that a test of the next is likely.
To make this strategy even more effective, one could even add fib levels for additional support and resistance zones.
I hope this helps and good luck to you all!
DISCLAIMER:
Please note I am only providing my own trading information for your benefit and insight to my trading techniques, you should do your own due diligence and not take this information as a trade signal.
ノート
Just because BTC broke the solid trendline, it does NOT mean this is bearish!Directly Below this broken level is a major trendline that will likely hold a lot of support. Then directly below that is historical support line. Both of these area could provide a lot of support so that BTC can continue on its bull run.
However!!! Watch for breaks in the levels, as they can be very bearish signals!
Good Luck!
I want to note that I am a short term Trader! I look at all of these small levels as potential profit.
ノート
Descending Triangles are rarely a good thing.Be careful

Creator of DepthHouse Indicators on TradingView!
↣ depthhouse.com/
↣ depthhouse.com/
関連の投稿
免責事項
これらの情報および投稿は、TradingViewが提供または承認する金融、投資、取引、またはその他の種類の助言もしくは推奨であることを意図したものではなく、またこれらに該当するものでもありません。詳細は利用規約をご覧ください。
Creator of DepthHouse Indicators on TradingView!
↣ depthhouse.com/
↣ depthhouse.com/
関連の投稿
免責事項
これらの情報および投稿は、TradingViewが提供または承認する金融、投資、取引、またはその他の種類の助言もしくは推奨であることを意図したものではなく、またこれらに該当するものでもありません。詳細は利用規約をご覧ください。