
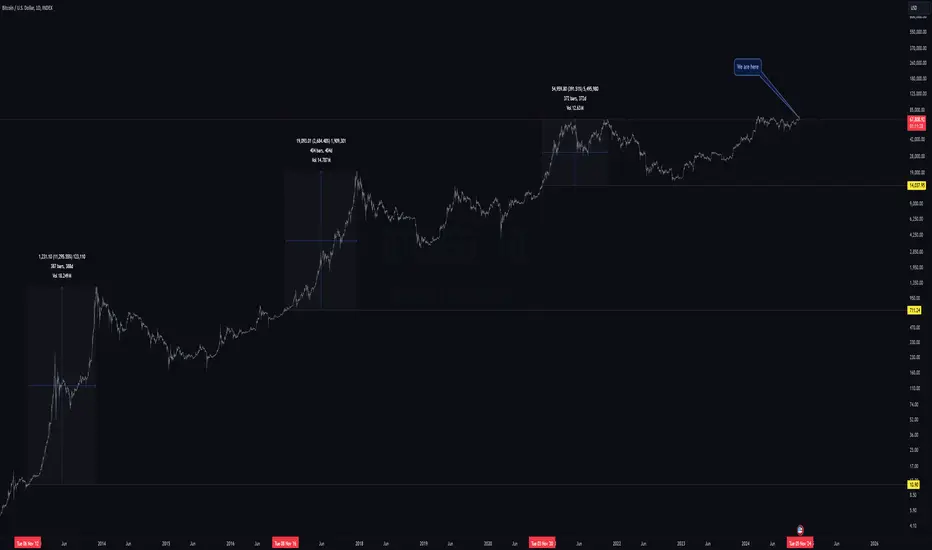
This charts the dates of the previous three US Elections (2012, 2016 and 2020) on a log chart, with price on the horizontal axis at daily candle close.
As you can see, once price breaks above (sometimes next day, as in 2020, sometimes a week or more later, as in 2016 and in 2012) price has never returned - ever.
Plotted are the time and percentage difference from election date to cycle ATH. On average it's 387 days apart.
If things play out this time in a similar fashion we can expect this week into mid next week to be the final time BTC will be in the mid 60k per coin - ever.
As you can see, once price breaks above (sometimes next day, as in 2020, sometimes a week or more later, as in 2016 and in 2012) price has never returned - ever.
Plotted are the time and percentage difference from election date to cycle ATH. On average it's 387 days apart.
If things play out this time in a similar fashion we can expect this week into mid next week to be the final time BTC will be in the mid 60k per coin - ever.

免責事項
これらの情報および投稿は、TradingViewが提供または承認する金融、投資、取引、またはその他の種類の助言もしくは推奨であることを意図したものではなく、またこれらに該当するものでもありません。詳細は利用規約をご覧ください。
免責事項
これらの情報および投稿は、TradingViewが提供または承認する金融、投資、取引、またはその他の種類の助言もしくは推奨であることを意図したものではなく、またこれらに該当するものでもありません。詳細は利用規約をご覧ください。