
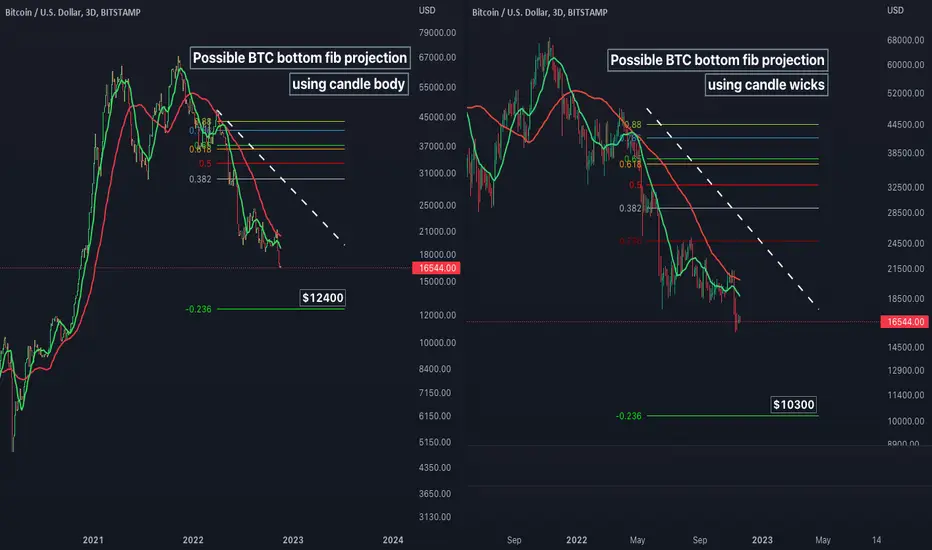
BTC price chart analysis on the 3Day time frame (Heikin-Ashi candles, wicks removed, log).
BTC appears to be completing a 5 wave down:
-I could go long layering in, if the price hits near these levels of -.23 fibonacci extension.
IMPORTANT
If the 3day 13 SMA crosses the 48 SMA up and both turn up, I default back to trend analysis
I could also add other indicators such as custom buy sell signals and or MACD , Stochastic , RSI , to assist my decisions but this is a simple projection.
None of this should be interpreted as financial advice, I am not a professional or certified financial adviser! all charts, and or analysis' are my personal opinions and observations only!
BTC appears to be completing a 5 wave down:
-I could go long layering in, if the price hits near these levels of -.23 fibonacci extension.
IMPORTANT
If the 3day 13 SMA crosses the 48 SMA up and both turn up, I default back to trend analysis
I could also add other indicators such as custom buy sell signals and or MACD , Stochastic , RSI , to assist my decisions but this is a simple projection.
None of this should be interpreted as financial advice, I am not a professional or certified financial adviser! all charts, and or analysis' are my personal opinions and observations only!

免責事項
これらの情報および投稿は、TradingViewが提供または承認する金融、投資、取引、またはその他の種類の助言もしくは推奨であることを意図したものではなく、またこれらに該当するものでもありません。詳細は利用規約をご覧ください。
免責事項
これらの情報および投稿は、TradingViewが提供または承認する金融、投資、取引、またはその他の種類の助言もしくは推奨であることを意図したものではなく、またこれらに該当するものでもありません。詳細は利用規約をご覧ください。