
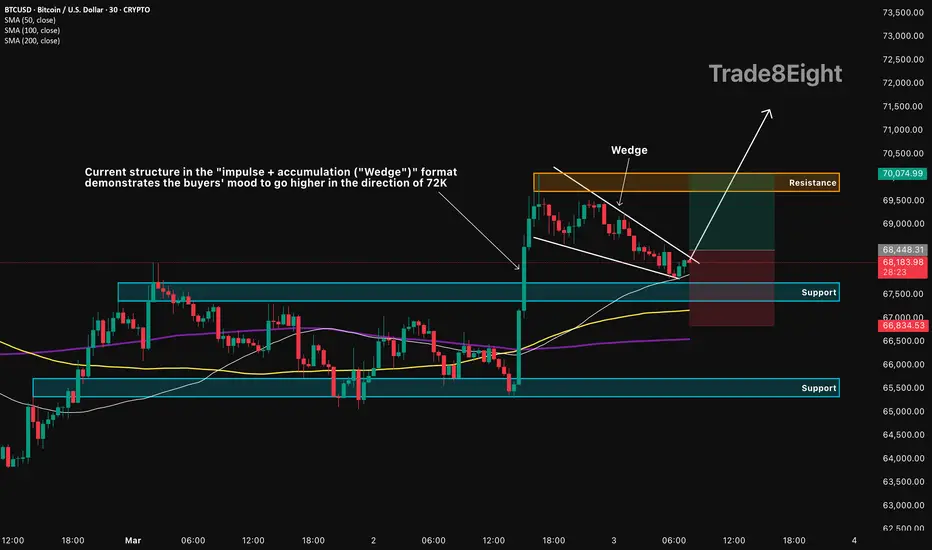
🛠 Technical Analysis: On the M15 chart, BTCUSD printed a strong bullish impulse and then transitioned into a tightening "Wedge" (impulse + accumulation), which often precedes continuation. Price is consolidating above the prior breakout area and holding inside a narrowing range, showing that sellers are struggling to push the market back into the old structure. The nearest demand zone sits around the marked support band (~67.5K), acting as the key base for the bullish scenario. The SMA cluster (50/100/200) remains below price, reinforcing that dips are being supported rather than sold aggressively. A confirmed break above the wedge ceiling and sustained hold above the pivot near 68,448 increases the probability of a push into the next resistance pocket. The first upside objective is the 70K+ resistance zone, with the chart also hinting at an extended continuation toward ~72K if momentum expands after the breakout.
———————————————
❗️Trade Parameters (BUY)
———————————————
➡️ Entry Point: 68,448.31
🎯 Take Profit: 70,074.99
🔴 Stop Loss: 66,834.53
⚠️ Disclaimer: This is a potential trade idea based on current analysis; market conditions and price direction are subject to change based on news factors and volatility.
———————————————
❗️Trade Parameters (BUY)
———————————————
➡️ Entry Point: 68,448.31
🎯 Take Profit: 70,074.99
🔴 Stop Loss: 66,834.53
⚠️ Disclaimer: This is a potential trade idea based on current analysis; market conditions and price direction are subject to change based on news factors and volatility.
ノート
🌍 Fundamental Analysis: Crypto sentiment remains headline-sensitive, renewed Middle East conflict risk has pressured risk assets and can cap BTC upside during rebound attempts. The market is still digesting late-February volatility (sharp selloff/forced liquidations), which typically keeps breakouts “noisy” and prone to quick pullbacks. At the same time, the current structure suggests buyers are trying to rebuild momentum, so a clean technical breakout could attract short-term flows—however, any renewed risk-off impulse could quickly send BTC back toward nearby supports.トレード稼働中
トレード終了: 利益確定目標に到達

⚠️ Public market view only. Not financial advice. DYOR and manage your own risk.
関連の投稿
免責事項
これらの情報および投稿は、TradingViewが提供または承認する金融、投資、取引、またはその他の種類の助言もしくは推奨であることを意図したものではなく、またこれらに該当するものでもありません。詳細は利用規約をご覧ください。
⚠️ Public market view only. Not financial advice. DYOR and manage your own risk.
関連の投稿
免責事項
これらの情報および投稿は、TradingViewが提供または承認する金融、投資、取引、またはその他の種類の助言もしくは推奨であることを意図したものではなく、またこれらに該当するものでもありません。詳細は利用規約をご覧ください。