
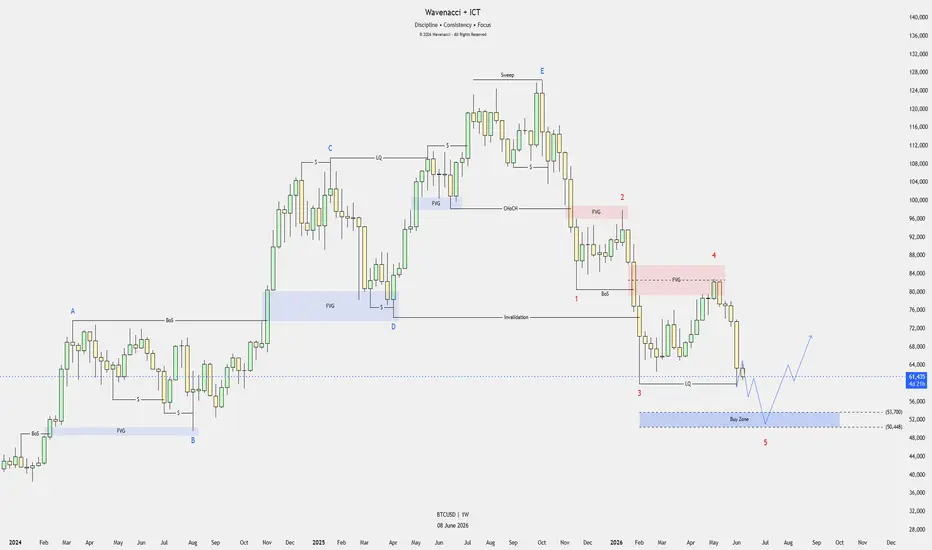
Despite the current bearish structure, the chart suggests that BTCUSD may be approaching the final stage of its corrective decline. From an Elliott Wave perspective, the ongoing sell-off appears to be developing as Wave 5, which could terminate within the major demand zone between 50,500 and 53,700.
This area is significant because it aligns with a higher-timeframe liquidity objective, previous imbalance, and a strong historical demand zone. A sweep into this region could complete the corrective structure and attract institutional buying interest.
The preferred buy scenario is to wait for price to reach the 50,500–53,700 buy zone, followed by signs of accumulation such as a liquidity sweep, bullish market structure shift, or strong rejection from the lows. Confirmation would increase the probability that Wave 5 has completed and that a larger recovery phase is beginning.
If buyers successfully defend this zone, BTCUSD could stage a recovery toward 61,000, followed by higher targets around 68,000–72,000. A stronger bullish reversal could eventually target the previous weekly imbalance near 80,000–85,000.
Key Levels:
• Weekly Resistance: 80,000-85,000 (FVG)
• Current Liquidity Level: Around 61,000
• Wave 5 Target Zone: 50,500-53,700
• Bias: Bearish until the major buy zone is reached
For now, patience remains key. Rather than buying into ongoing weakness, the higher-probability approach is to wait for price to complete its move into the major demand zone and look for confirmation that selling pressure is being absorbed before entering long positions.
This area is significant because it aligns with a higher-timeframe liquidity objective, previous imbalance, and a strong historical demand zone. A sweep into this region could complete the corrective structure and attract institutional buying interest.
The preferred buy scenario is to wait for price to reach the 50,500–53,700 buy zone, followed by signs of accumulation such as a liquidity sweep, bullish market structure shift, or strong rejection from the lows. Confirmation would increase the probability that Wave 5 has completed and that a larger recovery phase is beginning.
If buyers successfully defend this zone, BTCUSD could stage a recovery toward 61,000, followed by higher targets around 68,000–72,000. A stronger bullish reversal could eventually target the previous weekly imbalance near 80,000–85,000.
Key Levels:
• Weekly Resistance: 80,000-85,000 (FVG)
• Current Liquidity Level: Around 61,000
• Wave 5 Target Zone: 50,500-53,700
• Bias: Bearish until the major buy zone is reached
For now, patience remains key. Rather than buying into ongoing weakness, the higher-probability approach is to wait for price to complete its move into the major demand zone and look for confirmation that selling pressure is being absorbed before entering long positions.
ノート
Join Our Telegram ChannelGet free access to premium content and receive daily market analysis, trade setups, and key market updates. Stay informed and never miss potential trading opportunities.
Limited-time offer this month only. We will share in-depth technical analysis using a combination of proven trading methodologies, including Elliott Wave, Fibonacci, and ICT concepts such as Order Blocks and Liquidity. Gain valuable market insights and learn how these techniques can be applied to identify high-probability trading opportunities.
Join now: https:/t.me/wavenacci

関連の投稿
免責事項
これらの情報および投稿は、TradingViewが提供または承認する金融、投資、取引、またはその他の種類の助言もしくは推奨であることを意図したものではなく、またこれらに該当するものでもありません。詳細は利用規約をご覧ください。
免責事項
これらの情報および投稿は、TradingViewが提供または承認する金融、投資、取引、またはその他の種類の助言もしくは推奨であることを意図したものではなく、またこれらに該当するものでもありません。詳細は利用規約をご覧ください。