
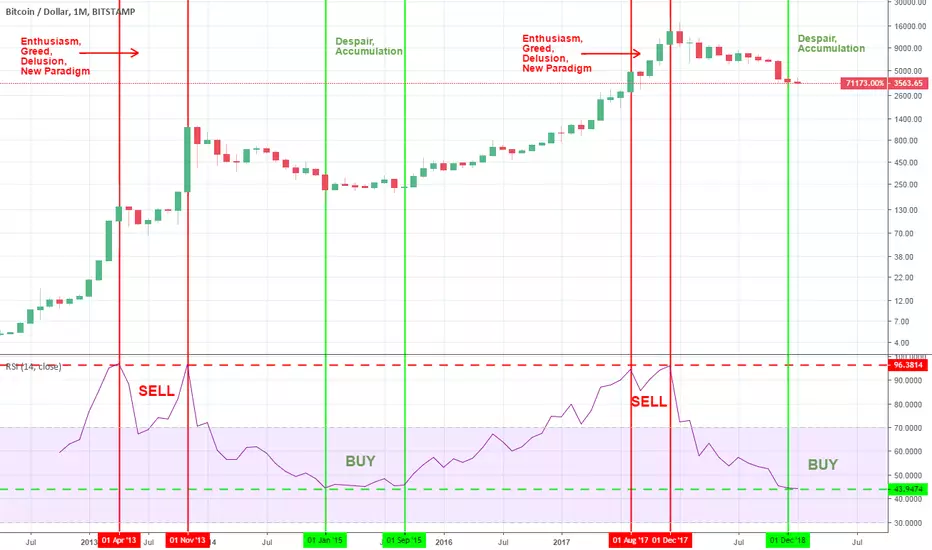
We continue our series of large scale studies on the long term behavioral charting of BTCUSD, this time by looking at the RSI.
On the Monthly chart the RSI has made a Double Top event during the previous economic cycle on April 2013 and November 2013. This was the 2013 uptrend's phase of Enthusiasm, Greed, Delusion and New Paradigm that eventually paved the way for the blow of the bubble stage and led to the 2014/ 2015 bear cycle. The RSI made a bottom sequence on that bear cycle within January - September 2015 where retail investors hit the despair phase but smart money and institutional investors started accumulating.
Similarly in the most recent (current) cycle, the RSI made a Double Top on August 2017 and December 2017 and last month (Dec 2018) hit the support of the previous cycle's accumulation phase. Based on the above parameters we can assume that this is the current "despair" phase for retail investors and the start of the accumulation phase for smart money and institutions that sold the 2017 Double Top.
The conclusion is that a bottom has been formed (always based on that model) and a prolonged consolidation period is ahead until the next bull run.
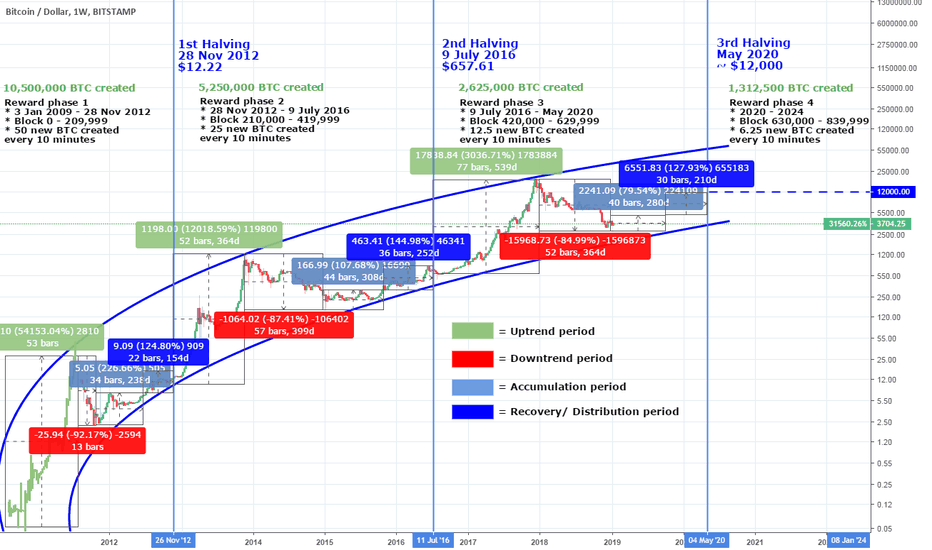
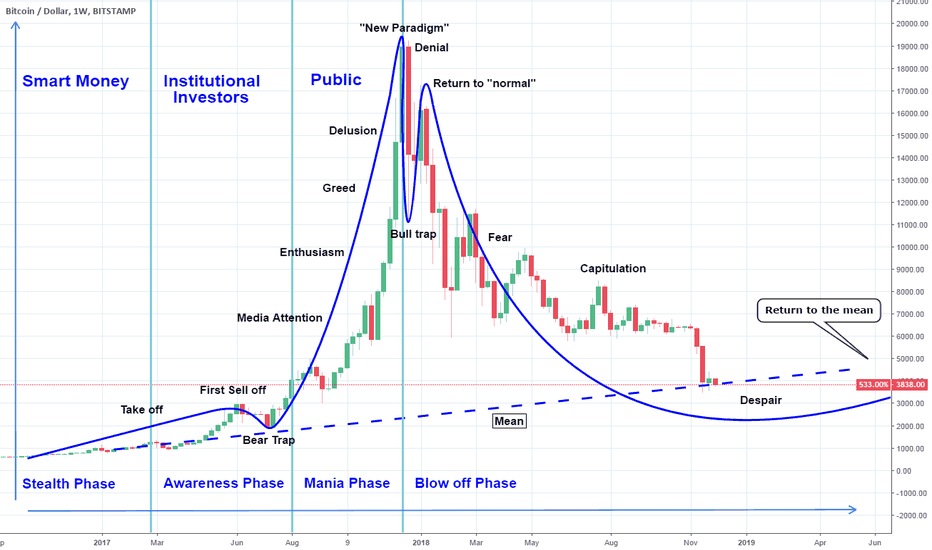
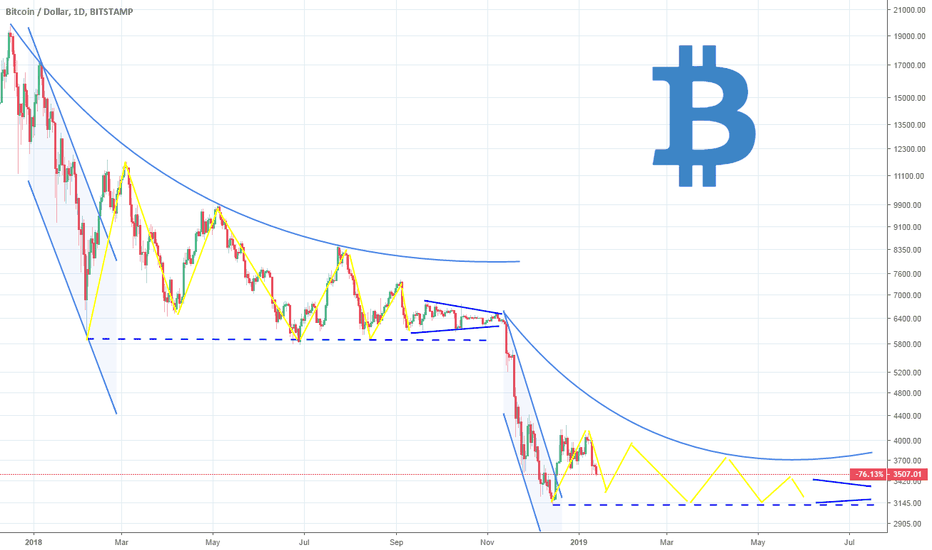
Have a look at some of our previous studies that are linked to the current chart:
** If you like our free content follow our profile (tradingview.com/u/InvestingScope) to get more daily ideas. **
Comments and likes are greatly appreciated.
On the Monthly chart the RSI has made a Double Top event during the previous economic cycle on April 2013 and November 2013. This was the 2013 uptrend's phase of Enthusiasm, Greed, Delusion and New Paradigm that eventually paved the way for the blow of the bubble stage and led to the 2014/ 2015 bear cycle. The RSI made a bottom sequence on that bear cycle within January - September 2015 where retail investors hit the despair phase but smart money and institutional investors started accumulating.
Similarly in the most recent (current) cycle, the RSI made a Double Top on August 2017 and December 2017 and last month (Dec 2018) hit the support of the previous cycle's accumulation phase. Based on the above parameters we can assume that this is the current "despair" phase for retail investors and the start of the accumulation phase for smart money and institutions that sold the 2017 Double Top.
The conclusion is that a bottom has been formed (always based on that model) and a prolonged consolidation period is ahead until the next bull run.
Have a look at some of our previous studies that are linked to the current chart:
** If you like our free content follow our profile (tradingview.com/u/InvestingScope) to get more daily ideas. **
Comments and likes are greatly appreciated.

I trade Crypto, Forex, Indices & Commodities all from one account on PrimeXBT with TradingView charts
Register here👉 investingscope.s.gy/PrimeXBT
Contact me for Account Management (+15% monthly profit)
Telegram👉 t.me/investingscope
Register here👉 investingscope.s.gy/PrimeXBT
Contact me for Account Management (+15% monthly profit)
Telegram👉 t.me/investingscope
関連の投稿
免責事項
これらの情報および投稿は、TradingViewが提供または承認する金融、投資、取引、またはその他の種類の助言もしくは推奨であることを意図したものではなく、またこれらに該当するものでもありません。詳細は利用規約をご覧ください。
I trade Crypto, Forex, Indices & Commodities all from one account on PrimeXBT with TradingView charts
Register here👉 investingscope.s.gy/PrimeXBT
Contact me for Account Management (+15% monthly profit)
Telegram👉 t.me/investingscope
Register here👉 investingscope.s.gy/PrimeXBT
Contact me for Account Management (+15% monthly profit)
Telegram👉 t.me/investingscope
関連の投稿
免責事項
これらの情報および投稿は、TradingViewが提供または承認する金融、投資、取引、またはその他の種類の助言もしくは推奨であることを意図したものではなく、またこれらに該当するものでもありません。詳細は利用規約をご覧ください。