
1. Market Drivers
Capital rotation is increasingly favoring AI-related equities and high-profile IPO opportunities, while institutional investors are reportedly withdrawing billions from spot Bitcoin ETF products. This shift reflects a weakening short-term crypto appetite as risk sentiment becomes more selective.
At the same time, bearish sentiment is gradually building in the market. Even Strategy, one of the most influential corporate Bitcoin holders, has signaled increased flexibility regarding potential Bitcoin sales if required, adding further psychological pressure on market participants.
2. Technical Analysis
a. Structure & Trend
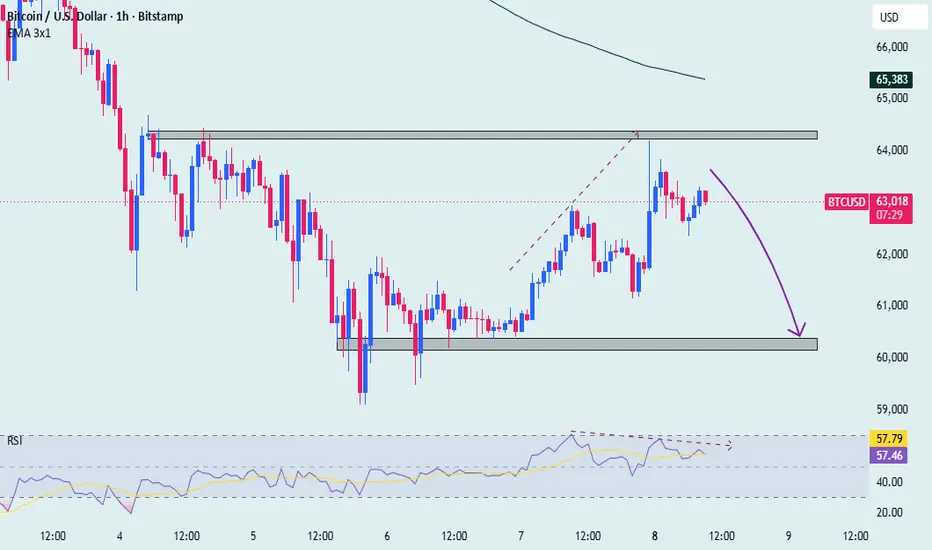
Bitcoin remains in a corrective recovery phase within a broader bearish/range structure.
Price rebounded strongly from the 60,000 – 60,500 demand zone.
The current move represents a recovery leg rather than a confirmed trend reversal.
No clear breakout structure has been established → market remains in sideways consolidation with corrective upside momentum.
On the 1H timeframe, RSI is showing bearish divergence, suggesting weakening upside momentum. This increases the probability of a rejection near resistance, potentially leading to another downside continuation after the current recovery phase.
b. Liquidity, Support & Resistance
🔴 Upper Liquidity / Resistance Zone: 64,000 – 64,300
Recent swing high area
Contains sell-side liquidity (stop hunts + profit-taking zones)
Strong reaction zone where sellers previously defended aggressively
🟢 Lower Liquidity / Demand Zone: 60,500 – 60,000
Key structural support on H1
Strong historical buying interest
Likely accumulation zone if price revisits
3. Outlook
Bitcoin is currently trading at a decision zone between recovery continuation and bearish rejection.
A sustained breakout above 64,000 would signal renewed bullish momentum and potential extension toward higher resistance levels.
Failure to break and hold above this zone increases the probability of rejection and continuation back toward the 60K liquidity area.
Market participants remain split between bullish breakout expectations and bearish continuation pressure, making this zone critical for directional confirmation.
Whishing you a successful trading day
Capital rotation is increasingly favoring AI-related equities and high-profile IPO opportunities, while institutional investors are reportedly withdrawing billions from spot Bitcoin ETF products. This shift reflects a weakening short-term crypto appetite as risk sentiment becomes more selective.
At the same time, bearish sentiment is gradually building in the market. Even Strategy, one of the most influential corporate Bitcoin holders, has signaled increased flexibility regarding potential Bitcoin sales if required, adding further psychological pressure on market participants.
2. Technical Analysis
a. Structure & Trend
Bitcoin remains in a corrective recovery phase within a broader bearish/range structure.
Price rebounded strongly from the 60,000 – 60,500 demand zone.
The current move represents a recovery leg rather than a confirmed trend reversal.
No clear breakout structure has been established → market remains in sideways consolidation with corrective upside momentum.
On the 1H timeframe, RSI is showing bearish divergence, suggesting weakening upside momentum. This increases the probability of a rejection near resistance, potentially leading to another downside continuation after the current recovery phase.
b. Liquidity, Support & Resistance
🔴 Upper Liquidity / Resistance Zone: 64,000 – 64,300
Recent swing high area
Contains sell-side liquidity (stop hunts + profit-taking zones)
Strong reaction zone where sellers previously defended aggressively
🟢 Lower Liquidity / Demand Zone: 60,500 – 60,000
Key structural support on H1
Strong historical buying interest
Likely accumulation zone if price revisits
3. Outlook
Bitcoin is currently trading at a decision zone between recovery continuation and bearish rejection.
A sustained breakout above 64,000 would signal renewed bullish momentum and potential extension toward higher resistance levels.
Failure to break and hold above this zone increases the probability of rejection and continuation back toward the 60K liquidity area.
Market participants remain split between bullish breakout expectations and bearish continuation pressure, making this zone critical for directional confirmation.
Whishing you a successful trading day
トレード稼働中
BTC continues to trade sideways in a tight range, waiting for a decisive breakoutトレード終了: 利益確定目標に到達
Complete the original plan
関連の投稿
免責事項
これらの情報および投稿は、TradingViewが提供または承認する金融、投資、取引、またはその他の種類の助言もしくは推奨であることを意図したものではなく、またこれらに該当するものでもありません。詳細は利用規約をご覧ください。
関連の投稿
免責事項
これらの情報および投稿は、TradingViewが提供または承認する金融、投資、取引、またはその他の種類の助言もしくは推奨であることを意図したものではなく、またこれらに該当するものでもありません。詳細は利用規約をご覧ください。