
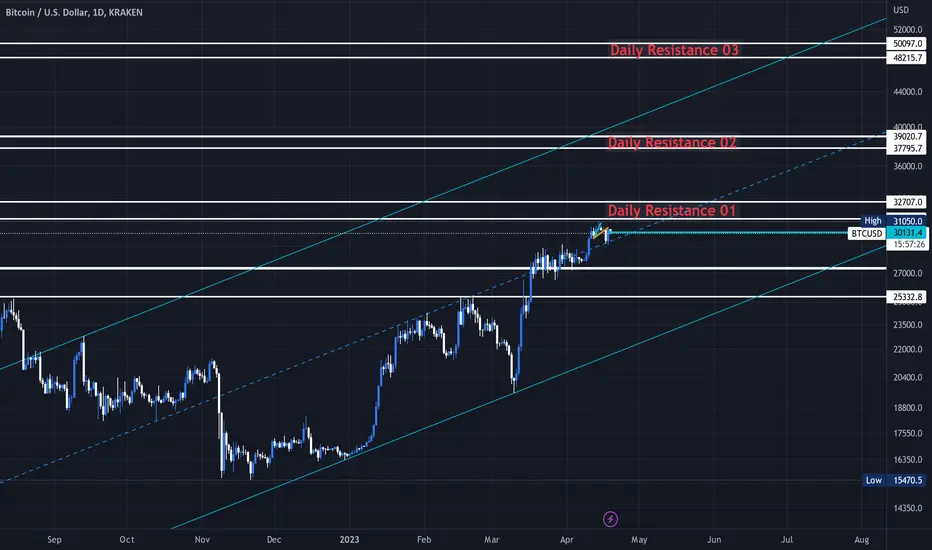
#Btc | #Analyse | 1D | #NUM_A24
Bitcoin is in a bullish channel on the daily time frame
Currently, the midline of the support channel and a strong daily static resistance is located in the region of 32707~31245.
The daily momentum is upward and the trend is also upward
As we said in the previous analysis
If the price rises to the resistance areas that we specified in the chart, you can look for sales setups

免責事項
これらの情報および投稿は、TradingViewが提供または承認する金融、投資、取引、またはその他の種類の助言もしくは推奨であることを意図したものではなく、またこれらに該当するものでもありません。詳細は利用規約をご覧ください。
免責事項
これらの情報および投稿は、TradingViewが提供または承認する金融、投資、取引、またはその他の種類の助言もしくは推奨であることを意図したものではなく、またこれらに該当するものでもありません。詳細は利用規約をご覧ください。