
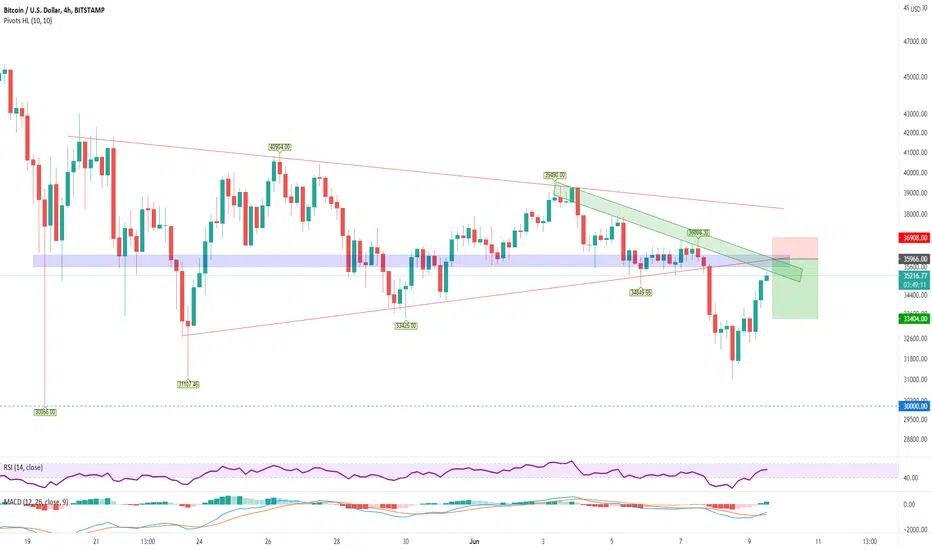
BTCUSD - Intraday - We look to Sell at 35966 (stop at 36908)
Daily signals are mildly bearish.
Trend line resistance is located at 35500.
Previous support, now becomes resistance at 35500.
Reverse trend line resistance comes in at 36000.
Early optimism is likely to lead to gains although extended attempts higher are expected to fail.
Bearish divergence can be seen on the 4 hour chart (the chart makes a higher high while the oscillator makes a lower high), often a signal of exhausted bullish momentum, or at least a correction lower.
Broken out of the triangle formation to the downside.
Our profit targets will be 33404 and 32404
Resistance: 35500 / 36500 / 37500
Support: 34500 / 33500 / 32800
Daily signals are mildly bearish.
Trend line resistance is located at 35500.
Previous support, now becomes resistance at 35500.
Reverse trend line resistance comes in at 36000.
Early optimism is likely to lead to gains although extended attempts higher are expected to fail.
Bearish divergence can be seen on the 4 hour chart (the chart makes a higher high while the oscillator makes a lower high), often a signal of exhausted bullish momentum, or at least a correction lower.
Broken out of the triangle formation to the downside.
Our profit targets will be 33404 and 32404
Resistance: 35500 / 36500 / 37500
Support: 34500 / 33500 / 32800
トレード終了: ストップロスに到達

関連の投稿
免責事項
これらの情報および投稿は、TradingViewが提供または承認する金融、投資、取引、またはその他の種類の助言もしくは推奨であることを意図したものではなく、またこれらに該当するものでもありません。詳細は利用規約をご覧ください。
免責事項
これらの情報および投稿は、TradingViewが提供または承認する金融、投資、取引、またはその他の種類の助言もしくは推奨であることを意図したものではなく、またこれらに該当するものでもありません。詳細は利用規約をご覧ください。