
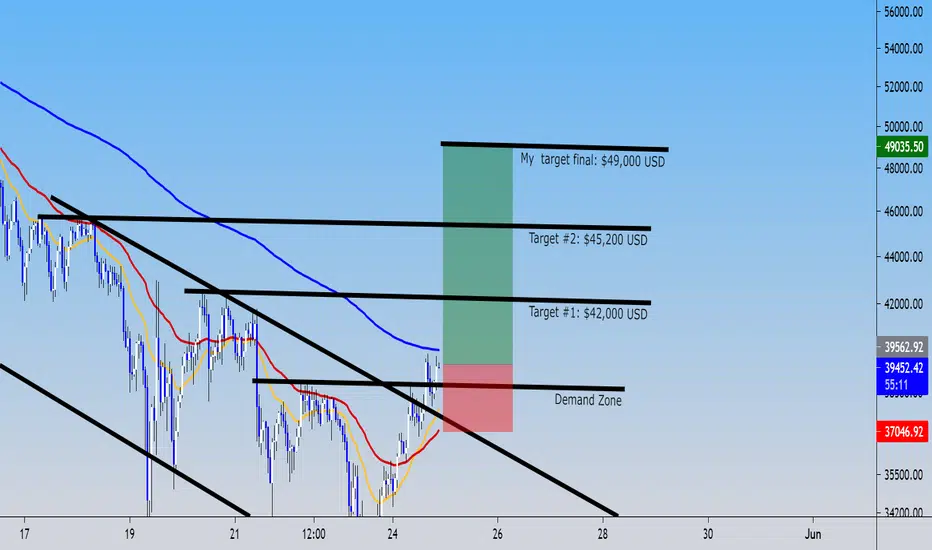
In this chart, we see that Bitcoin broke up this bullish flag; reversal pattern. So, that mean that Bitcoin have al chances to continue up in this week to $49,000 USD, my target profit.
s3.tradingview.com/snapshots/g/gm1zyMmH.png
This it's the H4 timeframe and the chartist pattern that I said: the bullish flag!!!
So guys, in my other analysis of bear market, will be closed up inmediately as Bitcoin continue up and get some profit of the short position, then, you can to entry right now in H1 timeframe and put the SL at $37,000 USD and consider these targets to reach in this up in this beautiful trade.
Good luck!!!
s3.tradingview.com/snapshots/g/gm1zyMmH.png
This it's the H4 timeframe and the chartist pattern that I said: the bullish flag!!!
So guys, in my other analysis of bear market, will be closed up inmediately as Bitcoin continue up and get some profit of the short position, then, you can to entry right now in H1 timeframe and put the SL at $37,000 USD and consider these targets to reach in this up in this beautiful trade.
Good luck!!!
トレード終了: ストップロスに到達
Bitcoin touch our SL, but it´s still bullish, but we see that form a shoulder head shoulder.
免責事項
これらの情報および投稿は、TradingViewが提供または承認する金融、投資、取引、またはその他の種類の助言もしくは推奨であることを意図したものではなく、またこれらに該当するものでもありません。詳細は利用規約をご覧ください。
免責事項
これらの情報および投稿は、TradingViewが提供または承認する金融、投資、取引、またはその他の種類の助言もしくは推奨であることを意図したものではなく、またこれらに該当するものでもありません。詳細は利用規約をご覧ください。