
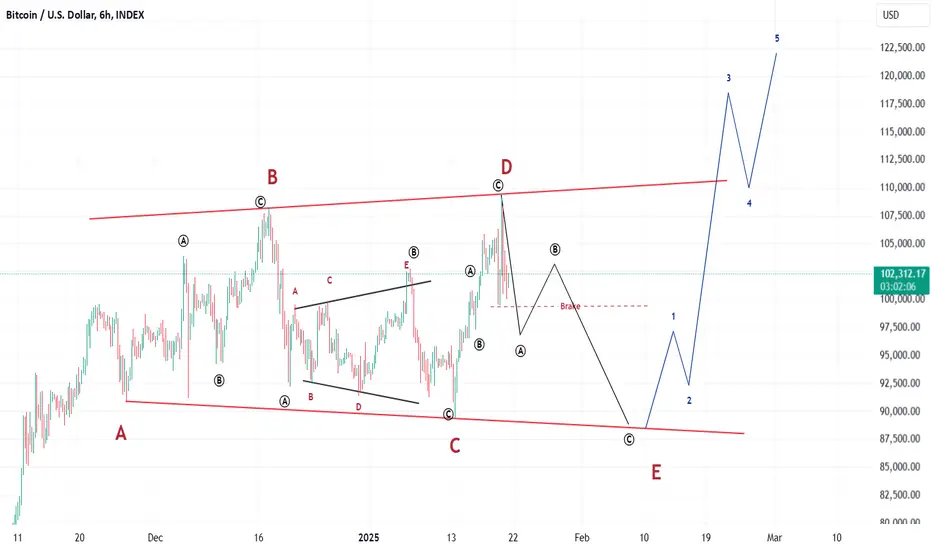
BTC peaked on November 23 and then entered a sideways corrective formation.
The corrective formation is called a reverse triangle, and it is characterized by the following features:
Three consecutive lower bottoms (A-B-C)
Two consecutive higher tops (B-D)
With the potential completion of the E bottom of the triangle, we can take a buy position on a lower timeframe if we identify a reversal pattern at the bottoms.
The initial target is a new all-time high.
The corrective formation is called a reverse triangle, and it is characterized by the following features:
Three consecutive lower bottoms (A-B-C)
Two consecutive higher tops (B-D)
With the potential completion of the E bottom of the triangle, we can take a buy position on a lower timeframe if we identify a reversal pattern at the bottoms.
The initial target is a new all-time high.

免責事項
これらの情報および投稿は、TradingViewが提供または承認する金融、投資、取引、またはその他の種類の助言もしくは推奨であることを意図したものではなく、またこれらに該当するものでもありません。詳細は利用規約をご覧ください。
免責事項
これらの情報および投稿は、TradingViewが提供または承認する金融、投資、取引、またはその他の種類の助言もしくは推奨であることを意図したものではなく、またこれらに該当するものでもありません。詳細は利用規約をご覧ください。