
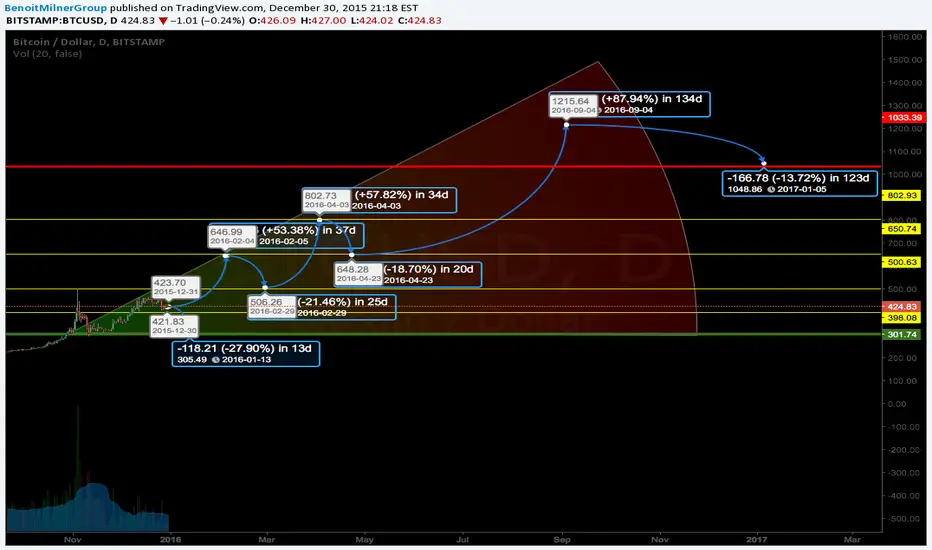
This is our Year Long Structure. If we see a break below $300 during the year the we should expect further selling but
We expect to see a gradual rise back to $1200 during 2016
The yellow lines represent "Key Levels" which could act as a support or a resistance.
The red and green lines represent "Strong Support & Strong Resistance.
But this is another very good guideline for trading BTC in 2016.
Posting some short term BTC ideas for January.
Remember to follow and any questions just comment!
We expect to see a gradual rise back to $1200 during 2016
The yellow lines represent "Key Levels" which could act as a support or a resistance.
The red and green lines represent "Strong Support & Strong Resistance.
But this is another very good guideline for trading BTC in 2016.
Posting some short term BTC ideas for January.
Remember to follow and any questions just comment!

免責事項
これらの情報および投稿は、TradingViewが提供または承認する金融、投資、取引、またはその他の種類の助言もしくは推奨であることを意図したものではなく、またこれらに該当するものでもありません。詳細は利用規約をご覧ください。
免責事項
これらの情報および投稿は、TradingViewが提供または承認する金融、投資、取引、またはその他の種類の助言もしくは推奨であることを意図したものではなく、またこれらに該当するものでもありません。詳細は利用規約をご覧ください。