
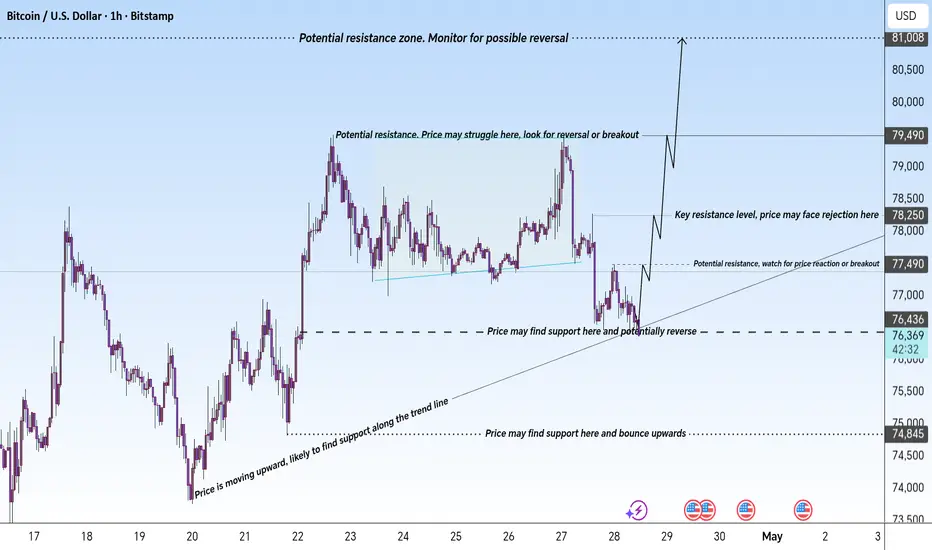
This chart provides a detailed analysis of Bitcoin (BTC/USD), focusing on critical support and resistance levels. The Key Resistance at 78,000 USD is a strong level to monitor for potential rejection or breakout, while 77,000 USD serves as a minor resistance point. On the downside, Support at 74,845 USD and 76,537 USD are key levels where price may find support and reverse upwards
The Upward Trend Line indicates ongoing bullish momentum, suggesting further price movement higher unless disrupted by a breakout or reversal at these levels. Traders should keep a close watch on these levels for potential trading opportunities based on market reactions
The Upward Trend Line indicates ongoing bullish momentum, suggesting further price movement higher unless disrupted by a breakout or reversal at these levels. Traders should keep a close watch on these levels for potential trading opportunities based on market reactions
トレード稼働中
Keep strong hold wait for my last target 🎯 トレード終了: 利益確定目標に到達
ノート
20% trades hold more
t.me/+HstI692sUGw0ZmRk
✅ MY FREE SIGNALS CHANNEL
✅ PERSONAL TELEGRAM
✅ FOREX BROKER USED
t.me/+pg7FHDH9Zl40MGJk
✅ MY FREE SIGNALS CHANNEL
✅ PERSONAL TELEGRAM
✅ FOREX BROKER USED
t.me/+pg7FHDH9Zl40MGJk
関連の投稿
免責事項
これらの情報および投稿は、TradingViewが提供または承認する金融、投資、取引、またはその他の種類の助言もしくは推奨であることを意図したものではなく、またこれらに該当するものでもありません。詳細は利用規約をご覧ください。
t.me/+HstI692sUGw0ZmRk
✅ MY FREE SIGNALS CHANNEL
✅ PERSONAL TELEGRAM
✅ FOREX BROKER USED
t.me/+pg7FHDH9Zl40MGJk
✅ MY FREE SIGNALS CHANNEL
✅ PERSONAL TELEGRAM
✅ FOREX BROKER USED
t.me/+pg7FHDH9Zl40MGJk
関連の投稿
免責事項
これらの情報および投稿は、TradingViewが提供または承認する金融、投資、取引、またはその他の種類の助言もしくは推奨であることを意図したものではなく、またこれらに該当するものでもありません。詳細は利用規約をご覧ください。