
Technical Analysis and Outlook:
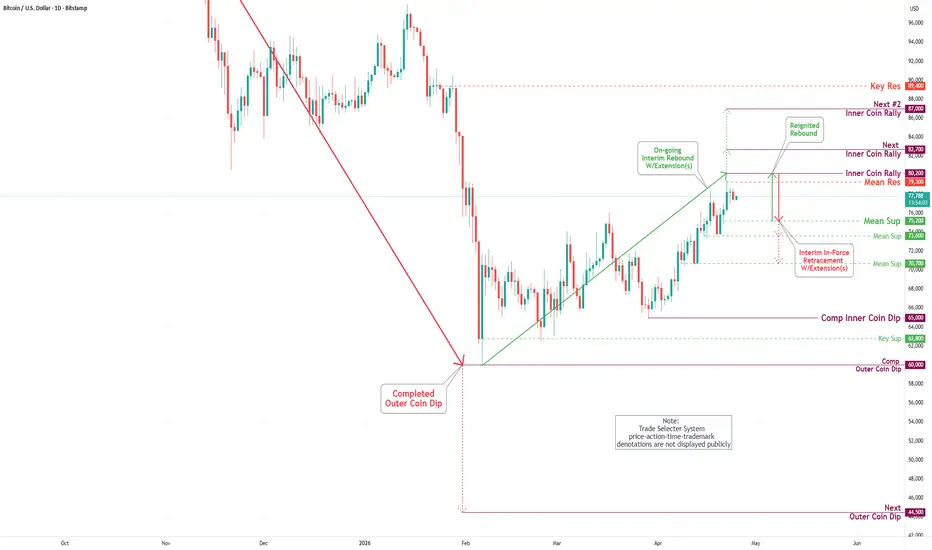
Bitcoin prices retested a crucial support level at $74,000 in this week's trading session and then surged strongly to the upside, retesting the Inner Coin rally at $78,500. Currently, the cryptocurrency is unfolding an upward move towards the extended target of $80,200, via a Key Resistance at $79,300.
Advanced market analysis indicates a continuous upward momentum towards the specified target. However, once this target is reached, we anticipate an interim retracement down to the identified Mean Support at $75,200, with additional potential support target levels at $73,600 and $70,700 to consider.
In light of all relevant factors, a notable rebound is expected to occur upon reaching the identified support levels.
Bitcoin prices retested a crucial support level at $74,000 in this week's trading session and then surged strongly to the upside, retesting the Inner Coin rally at $78,500. Currently, the cryptocurrency is unfolding an upward move towards the extended target of $80,200, via a Key Resistance at $79,300.
Advanced market analysis indicates a continuous upward momentum towards the specified target. However, once this target is reached, we anticipate an interim retracement down to the identified Mean Support at $75,200, with additional potential support target levels at $73,600 and $70,700 to consider.
In light of all relevant factors, a notable rebound is expected to occur upon reaching the identified support levels.

関連の投稿
免責事項
これらの情報および投稿は、TradingViewが提供または承認する金融、投資、取引、またはその他の種類の助言もしくは推奨であることを意図したものではなく、またこれらに該当するものでもありません。詳細は利用規約をご覧ください。
免責事項
これらの情報および投稿は、TradingViewが提供または承認する金融、投資、取引、またはその他の種類の助言もしくは推奨であることを意図したものではなく、またこれらに該当するものでもありません。詳細は利用規約をご覧ください。