
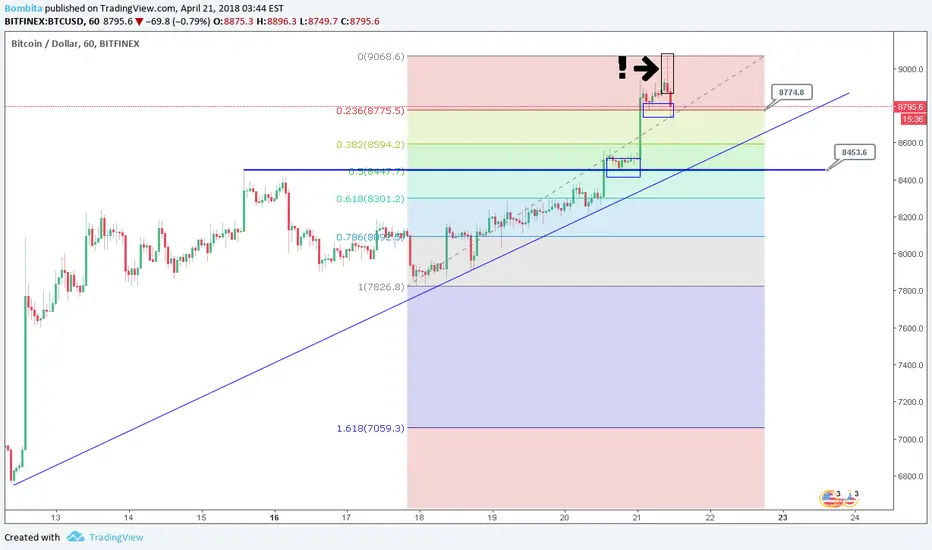
The falling star
On the hour chart we can see the falling star pattern ( in the black rectangle ) It's the bearish reversal pattern , be careful.
I marked the support zones and trend line.
Let's see what happens next.
The MACD divergence

The RSI overbought

On the hour chart we can see the falling star pattern ( in the black rectangle ) It's the bearish reversal pattern , be careful.
I marked the support zones and trend line.
Let's see what happens next.
The MACD divergence
The RSI overbought
ノート
On the hour chart we can se the peculiar pennant.ENTRY The closure of the four hour candle above the level of 9070 or 8999 ( less safe )
ノート
ImportantlyThe closure of the four hour candle above the level of 9070 will mean cancellation the falling star pattern.
It's will be the strong bullish sign
ノート
ImportantlyThe closure of the four hour candle above the level of 9070 will mean the cancellation of the falling star pattern
It's will be the strong bullish sign
ノート
The price tests the resistance levelノート
The another falling star , be careful ノート
I have adjusted the trading range.STOP-LIMIT 9341 ( In case of a sharp rise )
ENTRY The closure of the four hour candle above the level of 9070
ノート
The MACD shows the change of trend , it's the weak signal , but be careful ノート
The price confirmed the trend line againThe resistance zones

免責事項
これらの情報および投稿は、TradingViewが提供または承認する金融、投資、取引、またはその他の種類の助言もしくは推奨であることを意図したものではなく、またこれらに該当するものでもありません。詳細は利用規約をご覧ください。
免責事項
これらの情報および投稿は、TradingViewが提供または承認する金融、投資、取引、またはその他の種類の助言もしくは推奨であることを意図したものではなく、またこれらに該当するものでもありません。詳細は利用規約をご覧ください。