
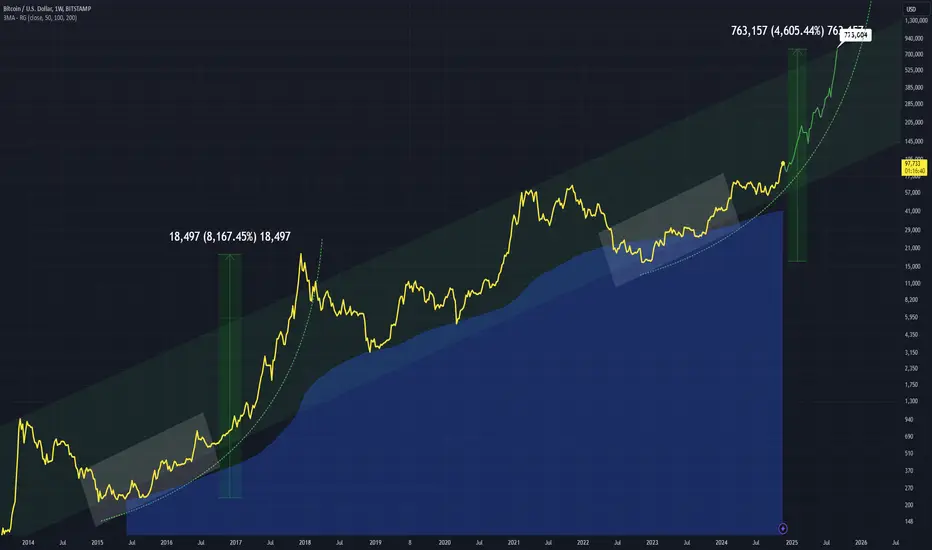
Showing a run that is very alike the 2017 one, which was an 8000% move from the low.
A move towards the top of the channel from the 2023 low is 4600% putting the price at over 770K
The blue area is just the 200MA which shows consistent support
Is this realistic? Leave comments below
A move towards the top of the channel from the 2023 low is 4600% putting the price at over 770K
The blue area is just the 200MA which shows consistent support
Is this realistic? Leave comments below

免責事項
これらの情報および投稿は、TradingViewが提供または承認する金融、投資、取引、またはその他の種類の助言もしくは推奨であることを意図したものではなく、またこれらに該当するものでもありません。詳細は利用規約をご覧ください。
免責事項
これらの情報および投稿は、TradingViewが提供または承認する金融、投資、取引、またはその他の種類の助言もしくは推奨であることを意図したものではなく、またこれらに該当するものでもありません。詳細は利用規約をご覧ください。