
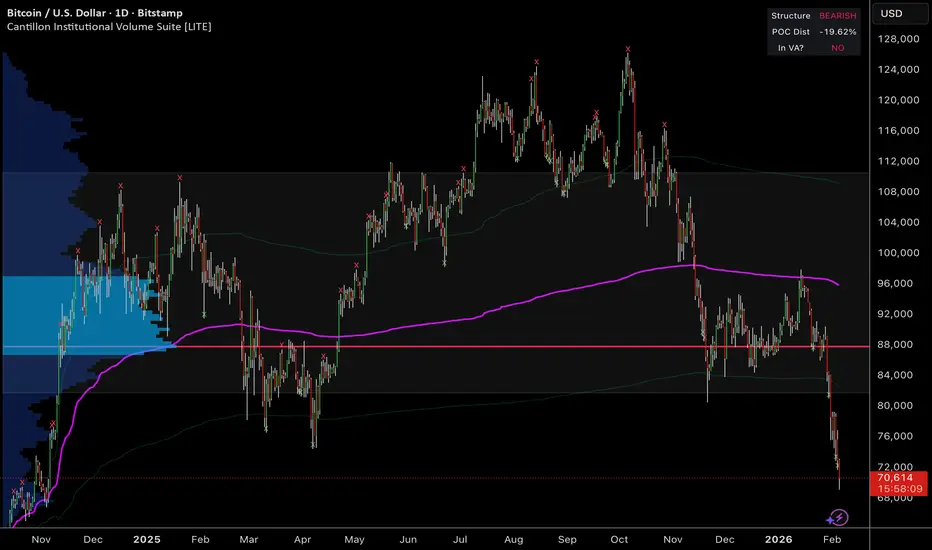
Educational Focus: Understanding AVWAP positioning and volume profile principles in trending markets
Volume Profile Context
The daily timeframe reveals a critical structural breakdown below the anchored VWAP (purple line), which has been tracking institutional positioning since the November 2024 accumulation base.
Key Educational Concepts:
1. AVWAP as Regime Filter
The Anchored Volume Weighted Average Price serves as a dynamic assessment of institutional cost basis from a significant swing point. In this case, the anchor originated from the November low, tracking the entire rally through $128,000.
Current price action trading -19.71% below this institutional reference level signals a bearish regime. In volume-based analysis, sustained trading below AVWAP typically indicates:
Original buyers in losing positions
Reduced institutional sponsorship at current levels
Higher probability of continued weakness until structure rebuilds
2. Point of Control (POC) Analysis
The red horizontal line at $88,000 represents the highest volume node from the swing structure—the price level where the most trading activity occurred. This serves as a "fair value" reference for institutional positioning.
With current price -19.71% away from POC, we observe significant dislocation. Volume theory suggests POC acts as a magnet during consolidation periods, but during trending phases, distance from POC indicates the strength of directional conviction.
3. Volume Profile Shape
The left-side histogram displays volume distribution across price levels. Note the concentration around $88,000 and the thin volume areas (gaps) below $80,000. These low-volume nodes often see rapid price movement, as there are fewer participants willing to transact at those levels.
Structural Breakdown Analysis
Phase 1: Initial Distribution (September-October 2025)
Multiple liquidity sweeps (marked with 'x') above prior highs near $128,000 represent classic distribution behavior. Institutions often allow price to exceed obvious resistance to trigger breakout buyers, then distribute into that demand.
Phase 2: AVWAP Breakdown (November 2025)
The decisive break below the purple AVWAP line marked a regime shift from bullish structure to bearish. Notice the multiple failed reclaim attempts—each rally back to AVWAP was rejected, confirming institutional selling pressure.
Phase 3: Acceleration Phase (January-February 2026)
Once the $88,000 POC level failed, selling accelerated into thin volume areas. This represents capitulation behavior where cascading stop losses and forced liquidations create vertical price movement.
Educational Observations on Current Structure
1. Distance from Value
Price currently sits outside the Value Area (not visible on this chart timeframe but implied by the volume distribution). Trading outside value for extended periods typically leads to one of two outcomes:
Mean reversion: Sharp moves back toward POC/AVWAP
Trend continuation: New value area establishes at lower levels
2. Liquidity Sweep Patterns
The chart shows numerous liquidity sweeps (green and red 'x' markers) at prior swing highs and lows. These represent stop-hunt events where price briefly exceeds obvious levels to trigger orders before reversing. The frequency of sweeps indicates active institutional positioning.
3. Volume Gap Implications
The thin volume profile between $80,000-$72,000 suggests this region will likely trade quickly if tested. Institutional traders recognize these areas offer poor liquidity for large position building, making them transition zones rather than accumulation areas.
Volume-Based Framework for Analysis
This chart demonstrates several institutional volume principles:
Principle 1: Volume Precedes Price
The volume profile shows where institutions accumulated positions (high volume nodes) versus where they're absent (gaps). Current price action is "discovering" whether lower levels will attract institutional interest.
Principle 2: AVWAP as Cost Basis Reference
Professional traders use AVWAP as a benchmark for position profitability. When large participants are underwater (price < AVWAP), market behavior changes—reduced willingness to add to losing positions creates one-way price action.
Principle 3: POC as Equilibrium
The Point of Control represents market consensus on fair value for the swing period. Large deviations from POC create potential energy—either for reversal or for establishing new equilibrium.
Structural Considerations
Support/Resistance Reframing:
Rather than traditional horizontal S/R, volume-based analysis focuses on:
High Volume Nodes (HVN): Areas with thick volume bars where institutions have positions—these typically provide support/resistance
Low Volume Nodes (LVN): Thin volume areas that price moves through quickly
Value Area: The range containing 70% of volume—represents "fair value" range
Time vs. Structure:
Note that the volume profile resets when swing structure changes (new swing high or low forms). The current profile has been building since November, providing significant data on institutional positioning across a major trending move.
Educational Takeaways
Regime Definition Matters: Trading below AVWAP defines bearish bias. Counter-trend positions require exceptional confluence and risk management.
Volume Validates Price Action: The POC at $88,000 showed where institutions were most active. Its failure validated the bearish thesis.
Structure Over Prediction: Volume profile doesn't predict—it describes current positioning and identifies areas where institutional behavior may shift.
Confluence Builds Conviction: Strongest setups occur when multiple volume-based factors align (AVWAP, POC, Value Area, liquidity zones).
Framework Application
This analysis demonstrates how institutional traders use volume-weighted metrics to:
Define market regime (above/below AVWAP)
Identify fair value (POC and Value Area)
Recognize distribution patterns (liquidity sweeps at extremes)
Assess structural health (distance from value areas)
The methodology prioritizes structure over speculation, letting volume reveal where institutions are positioned rather than attempting to predict future movement.
Study Focus: How do volume profile and AVWAP positioning change your perspective versus traditional price-only chart analysis? Consider how institutional traders with large order flow might view these structural levels differently than retail participants.
This analysis is for educational purposes, demonstrating institutional volume analysis principles. Not financial advice.

Daily top picks analysis → free & paid tiers
Custom Institutional volume terminal included with paid sub
thecantillonreport.substack.com/?utm_source=tradingview
cantillonresearch.com/
youtube.com/@cantillonresearch
Custom Institutional volume terminal included with paid sub
thecantillonreport.substack.com/?utm_source=tradingview
cantillonresearch.com/
youtube.com/@cantillonresearch
免責事項
これらの情報および投稿は、TradingViewが提供または承認する金融、投資、取引、またはその他の種類の助言もしくは推奨であることを意図したものではなく、またこれらに該当するものでもありません。詳細は利用規約をご覧ください。
Daily top picks analysis → free & paid tiers
Custom Institutional volume terminal included with paid sub
thecantillonreport.substack.com/?utm_source=tradingview
cantillonresearch.com/
youtube.com/@cantillonresearch
Custom Institutional volume terminal included with paid sub
thecantillonreport.substack.com/?utm_source=tradingview
cantillonresearch.com/
youtube.com/@cantillonresearch
免責事項
これらの情報および投稿は、TradingViewが提供または承認する金融、投資、取引、またはその他の種類の助言もしくは推奨であることを意図したものではなく、またこれらに該当するものでもありません。詳細は利用規約をご覧ください。