
📊 BTC/USD 4H Market Structure Analysis
🧭 1️⃣ Macro Structure: Bearish Context
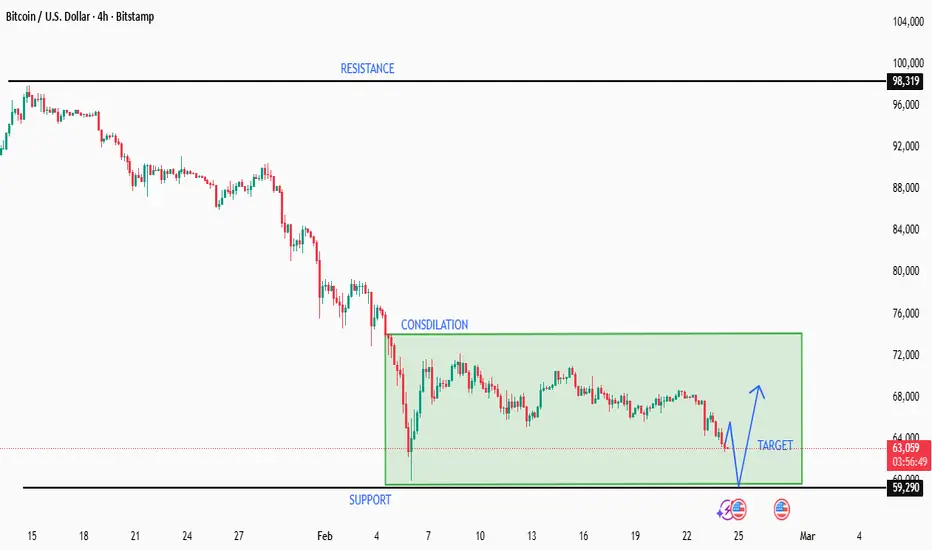
The chart clearly shows a strong impulsive downtrend from the highs near $98,319 (Resistance).
🔻 We observe:
Series of lower highs (LH)
Series of lower lows (LL)
Strong momentum breakdown into early February
This confirms that the primary market structure remains bearish.
📦 2️⃣ Current Phase: Range / Consolidation
Price is now trading inside a well-defined range:
🧱 Resistance (Range High): ~ $72,000
🛡 Support (Range Low): ~ $59,290
💰 Current price: ~$63,135
This is a classic post-impulse consolidation zone.
What This Means:
After a strong sell-off, the market is:
Absorbing supply
Building liquidity
Preparing for expansion
Range behavior suggests accumulation or distribution before the next major move.
🛡 3️⃣ Key Support: $59,290
This is a critical structural level.
If price:
✅ Holds → Potential bounce toward range highs ($70K–$72K)
❌ Breaks with momentum → Continuation toward new lows likely
A clean breakdown below support would confirm bearish continuation and invalidate short-term bullish scenarios.
🎯 4️⃣ Short-Term Projection (As Drawn on Chart)
The blue projection suggests:
Liquidity sweep below recent lows
Reaction from support
Rally toward mid-range or range high
This would be a typical:
🔎 Liquidity grab
📈 Short-term mean reversion
Before deciding the next major move
🔍 5️⃣ Volume & Structure Insight (Professional View)
This consolidation has:
Weak upward impulses
No strong bullish break of structure (BOS)
Repeated rejection near range highs
This behavior favors:
⚠️ Bearish continuation unless $72K breaks decisively.
📈 Bullish Scenario
For bullish confirmation, we need:
🔼 Strong 4H close above $72,000
Followed by higher high formation
Reclaim of broken supply
Target zones:
$76K
$80K
Then macro resistance near $98K
Probability: Lower unless structure shifts
📉 Bearish Scenario (Higher Probability)
If support fails:
First target: $55K
Then potential extension toward $50K–$48K
Momentum continuation toward macro liquidity
This aligns with:
Existing downtrend
Lack of bullish structure
Weak recovery legs
🧠 Professional Conclusion
📌 Macro Trend: Bearish
📌 Current Phase: Range Consolidation
📌 Key Decision Zone: $59,290
📌 Bias: Slightly Bearish until proven otherwise
This is a classic:
“Range inside a downtrend” — typically continuation structure.
🧭 1️⃣ Macro Structure: Bearish Context
The chart clearly shows a strong impulsive downtrend from the highs near $98,319 (Resistance).
🔻 We observe:
Series of lower highs (LH)
Series of lower lows (LL)
Strong momentum breakdown into early February
This confirms that the primary market structure remains bearish.
📦 2️⃣ Current Phase: Range / Consolidation
Price is now trading inside a well-defined range:
🧱 Resistance (Range High): ~ $72,000
🛡 Support (Range Low): ~ $59,290
💰 Current price: ~$63,135
This is a classic post-impulse consolidation zone.
What This Means:
After a strong sell-off, the market is:
Absorbing supply
Building liquidity
Preparing for expansion
Range behavior suggests accumulation or distribution before the next major move.
🛡 3️⃣ Key Support: $59,290
This is a critical structural level.
If price:
✅ Holds → Potential bounce toward range highs ($70K–$72K)
❌ Breaks with momentum → Continuation toward new lows likely
A clean breakdown below support would confirm bearish continuation and invalidate short-term bullish scenarios.
🎯 4️⃣ Short-Term Projection (As Drawn on Chart)
The blue projection suggests:
Liquidity sweep below recent lows
Reaction from support
Rally toward mid-range or range high
This would be a typical:
🔎 Liquidity grab
📈 Short-term mean reversion
Before deciding the next major move
🔍 5️⃣ Volume & Structure Insight (Professional View)
This consolidation has:
Weak upward impulses
No strong bullish break of structure (BOS)
Repeated rejection near range highs
This behavior favors:
⚠️ Bearish continuation unless $72K breaks decisively.
📈 Bullish Scenario
For bullish confirmation, we need:
🔼 Strong 4H close above $72,000
Followed by higher high formation
Reclaim of broken supply
Target zones:
$76K
$80K
Then macro resistance near $98K
Probability: Lower unless structure shifts
📉 Bearish Scenario (Higher Probability)
If support fails:
First target: $55K
Then potential extension toward $50K–$48K
Momentum continuation toward macro liquidity
This aligns with:
Existing downtrend
Lack of bullish structure
Weak recovery legs
🧠 Professional Conclusion
📌 Macro Trend: Bearish
📌 Current Phase: Range Consolidation
📌 Key Decision Zone: $59,290
📌 Bias: Slightly Bearish until proven otherwise
This is a classic:
“Range inside a downtrend” — typically continuation structure.
トレード稼働中
Yes — your analysis is working ✅
Price is moving toward range high (70–72K) 🎯
Now watch:
🔼 Strong break above 72K → continuation up
🔽 Rejection near 70–72K → drop back into range
Take profits into resistance. Don’t get greedy. 🔥
トレード終了: 利益確定目標に到達
✅ BTC/USD Trade Outcome – Target Hit 🎯
The projected scenario on this chart played out successfully.
Price swept liquidity below the recent lows 🧹, reacted strongly from the $59,290 support, and delivered the anticipated bounce inside the range.
📈 The move confirmed:
Clean liquidity grab
Strong reaction from key structural support
Short-term bullish expansion within a broader bearish trend
This was a textbook range reaction setup inside a macro downtrend.
Professional takeaway:
Structure + liquidity + patience = high-probability execution.

関連の投稿
免責事項
これらの情報および投稿は、TradingViewが提供または承認する金融、投資、取引、またはその他の種類の助言もしくは推奨であることを意図したものではなく、またこれらに該当するものでもありません。詳細は利用規約をご覧ください。
関連の投稿
免責事項
これらの情報および投稿は、TradingViewが提供または承認する金融、投資、取引、またはその他の種類の助言もしくは推奨であることを意図したものではなく、またこれらに該当するものでもありません。詳細は利用規約をご覧ください。