
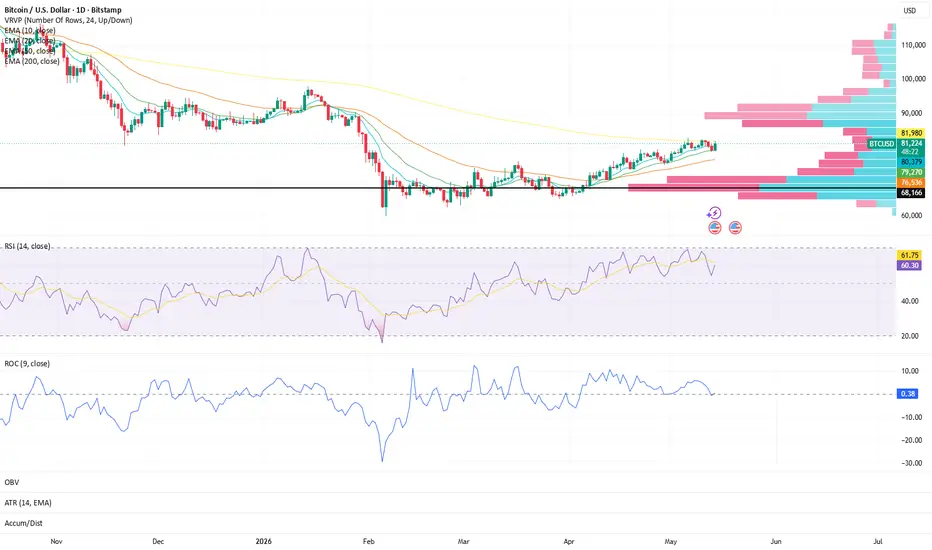
The 10, 20, and 50 EMAs remain in constructive alignment and are continuing to trend upward while approaching the 200 EMA — a level the market is now actively testing.
Historically, when shorter-term EMAs reclaim and cross above the 200 EMA, it can signal a major shift in longer-term structure, commonly referred to as a golden cross.
RSI (14) is holding steady near 60 while continuing to show constructive upward curvature, indicating participation remains healthy without reaching extreme conditions.
ROC is also holding steady around 0.51, reflecting stable momentum as price attempts to build continuation structure near a key long-term level.
What I’m Watching:
• Whether price can reclaim and hold above the 200 EMA
• Whether the 10/20/50 EMA stack continues strengthening beneath price
• Momentum confirmation through RSI and ROC if BTC begins establishing acceptance above this area
⭐ Final Clarity Note ⭐
The 200 EMA remains one of the most important long-term structure levels on the chart. When combined with healthy EMA alignment and stable momentum readings, this area can often become a key decision point between temporary relief movement and broader structural transition. Confirmation remains more important than prediction.

免責事項
これらの情報および投稿は、TradingViewが提供または承認する金融、投資、取引、またはその他の種類の助言もしくは推奨であることを意図したものではなく、またこれらに該当するものでもありません。詳細は利用規約をご覧ください。
免責事項
これらの情報および投稿は、TradingViewが提供または承認する金融、投資、取引、またはその他の種類の助言もしくは推奨であることを意図したものではなく、またこれらに該当するものでもありません。詳細は利用規約をご覧ください。