
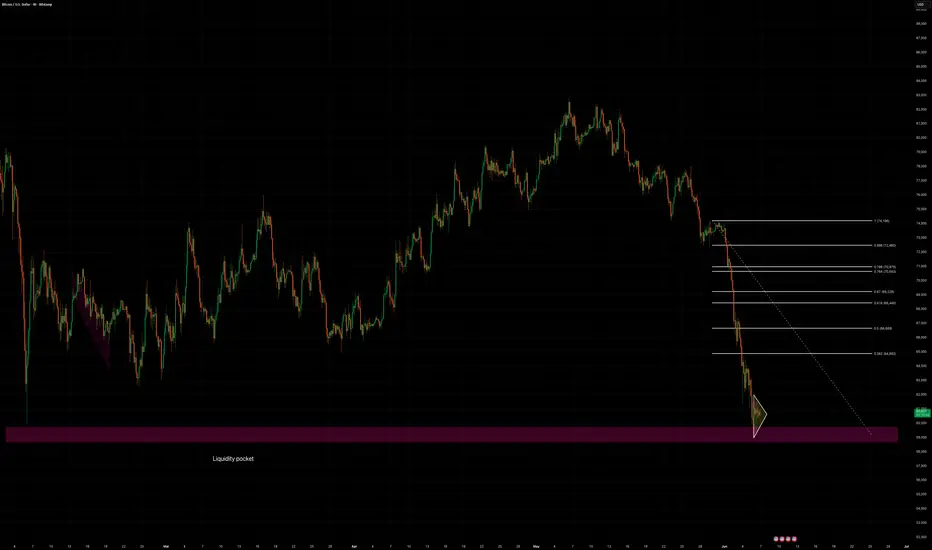
Bitcoin has successfully swept the critical liquidity pool dating back to February 6th and is currently consolidating within a bullish triangle reversal pattern. Following the unsustainable, sharp decline from the ~$74K highs, the market has left behind significant structural gaps (low volume nodes) that are ripe for filling. At this extreme point, the risk-to-reward (R:R) ratio heavily favors the bulls.
Technical Breakdown
The Trade Setup (High R:R)
This setup offers an excellent risk-to-reward ratio given our proximity to a major macro inflection point.
Technical Breakdown
- Liquidity Hunt Complete: The recent downside move effectively flushed out the liquidity pool created on February 6th, trapping late shorts and mitigating old demand.
- Chart Pattern: Price action is now compressing inside a bullish triangle reversal, signaling that the selling exhaustion phase is wrapping up.
- Volume Profile (VPVR): The rapid drop from the $74K all-time highs was highly inefficient, leaving behind multiple Low Volume Nodes (LVNs). Price tends to gravitate through these zones quickly once a reversal is confirmed.
- Momentum Indicator: The MACD is actively rolling over into bullish territory on the higher timeframes, confirming a shift in momentum.
The Trade Setup (High R:R)
This setup offers an excellent risk-to-reward ratio given our proximity to a major macro inflection point.
- Direction: Long 🟢
- Immediate Target: $63,000 (First major resistance / LVN retest)
- Extended Target: $67,000 (Key structural supply zone)
- Invalidation: A clean breakdown and close below the triangle support/recent swing low.

免責事項
これらの情報および投稿は、TradingViewが提供または承認する金融、投資、取引、またはその他の種類の助言もしくは推奨であることを意図したものではなく、またこれらに該当するものでもありません。詳細は利用規約をご覧ください。
免責事項
これらの情報および投稿は、TradingViewが提供または承認する金融、投資、取引、またはその他の種類の助言もしくは推奨であることを意図したものではなく、またこれらに該当するものでもありません。詳細は利用規約をご覧ください。