
Look at the monthly timeframe
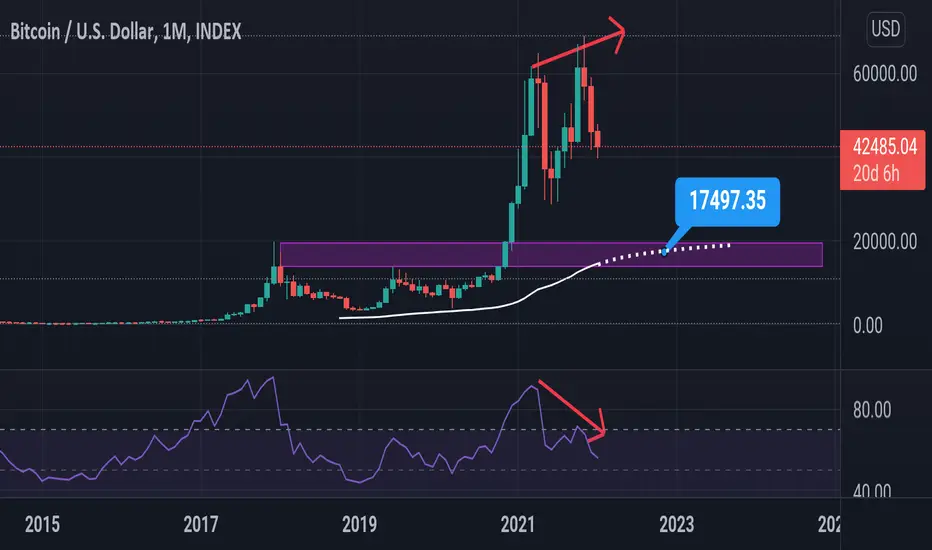
What do you see? Higher timeframes never lie and they're very simple to understand! We see a double top around 60_70K which is a very strong resistance also we see a bearish divergence because as price making higher highs RSI making lower highs also RSI is overbought. There's a support around 18_13K and also 100 monthly EMA is exactly there to support the price in future. These are very simple and obvious. Now you look at the chart and tell me what do you expect from bitcoin?
What do you see? Higher timeframes never lie and they're very simple to understand! We see a double top around 60_70K which is a very strong resistance also we see a bearish divergence because as price making higher highs RSI making lower highs also RSI is overbought. There's a support around 18_13K and also 100 monthly EMA is exactly there to support the price in future. These are very simple and obvious. Now you look at the chart and tell me what do you expect from bitcoin?
ノート
As you see guys higher timeframes never lie. When we're bearish in higher timeframes it means indeed we're bearish in longterm.17K is in sight.

関連の投稿
免責事項
これらの情報および投稿は、TradingViewが提供または承認する金融、投資、取引、またはその他の種類の助言もしくは推奨であることを意図したものではなく、またこれらに該当するものでもありません。詳細は利用規約をご覧ください。
免責事項
これらの情報および投稿は、TradingViewが提供または承認する金融、投資、取引、またはその他の種類の助言もしくは推奨であることを意図したものではなく、またこれらに該当するものでもありません。詳細は利用規約をご覧ください。