
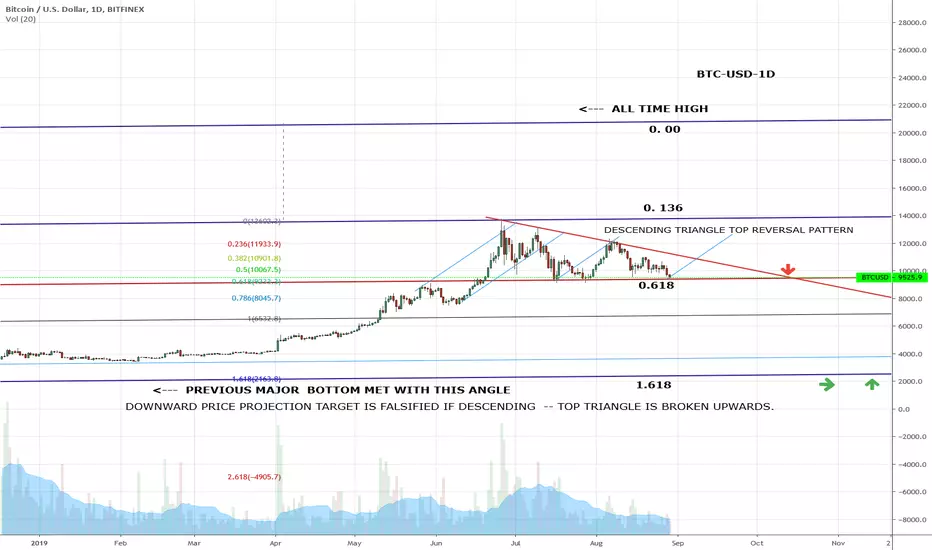
The slightly rising trendlines used in price projection are estimates of the dominating angle where price reacts most to these trendlines.
Descending triangles can be also top or bottom trend reversal patterns.
In this triangle price projection is made from all time high to 0.1360 projection distance.
The almost horizontal bottom of the triangle is at 0.618 projection level -- and the price projection down is at the 1.618 level.
That level meets major previous bottom with the lowest parallel trendline .
Price reactions at 0.786 and 1.00 projection levels should be confirmations of that the trendlines angle is correct.
If price breaks upwards from the triangle -- the price projections down are falsified.
Descending triangles can be also top or bottom trend reversal patterns.
In this triangle price projection is made from all time high to 0.1360 projection distance.
The almost horizontal bottom of the triangle is at 0.618 projection level -- and the price projection down is at the 1.618 level.
That level meets major previous bottom with the lowest parallel trendline .
Price reactions at 0.786 and 1.00 projection levels should be confirmations of that the trendlines angle is correct.
If price breaks upwards from the triangle -- the price projections down are falsified.
ノート
Now the price is at breakup or dropdown level
免責事項
これらの情報および投稿は、TradingViewが提供または承認する金融、投資、取引、またはその他の種類の助言もしくは推奨であることを意図したものではなく、またこれらに該当するものでもありません。詳細は利用規約をご覧ください。
免責事項
これらの情報および投稿は、TradingViewが提供または承認する金融、投資、取引、またはその他の種類の助言もしくは推奨であることを意図したものではなく、またこれらに該当するものでもありません。詳細は利用規約をご覧ください。