
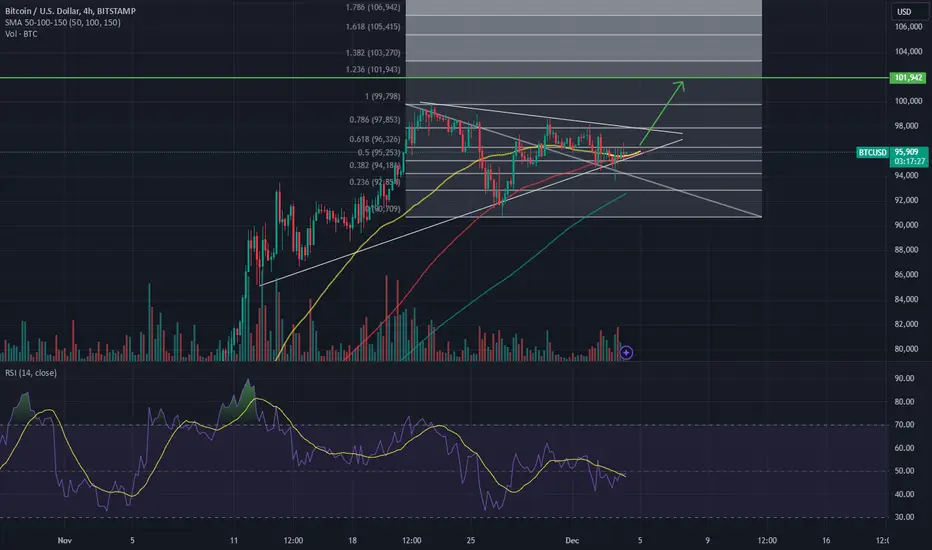
Im posting this idea because the formation the price action is making is a rising wedge. This shape has a bias toward breaking down and forming new lows. In this case, the 50 simple moving average has managed to stay above the 100 simple moving average and the price has managed to hold above the 50 simple moving average. RSI is only 48 at time of publishing on the H4 Chart.
I think BTC will break to the upside here and manage to print a price above 100k. Minimum target is 101,900 the 1.236 extension from previous High swing Low.
Not financial Advice, do your own DD.
Thanks for viewing the idea.
I think BTC will break to the upside here and manage to print a price above 100k. Minimum target is 101,900 the 1.236 extension from previous High swing Low.
Not financial Advice, do your own DD.
Thanks for viewing the idea.
ノート
here is the pa, 50 and 100 simple moving average all respecting eachother
関連の投稿
免責事項
これらの情報および投稿は、TradingViewが提供または承認する金融、投資、取引、またはその他の種類の助言もしくは推奨であることを意図したものではなく、またこれらに該当するものでもありません。詳細は利用規約をご覧ください。
関連の投稿
免責事項
これらの情報および投稿は、TradingViewが提供または承認する金融、投資、取引、またはその他の種類の助言もしくは推奨であることを意図したものではなく、またこれらに該当するものでもありません。詳細は利用規約をご覧ください。