
Update to my ongoing analysis of Bitcoin moves (see links below).
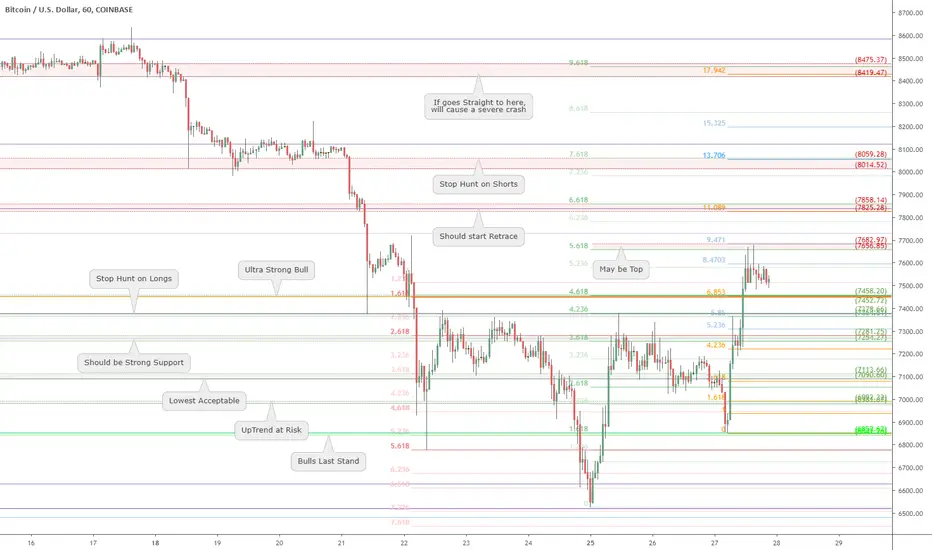
BTC got a strong bounce from $6500 and then $6850 (both plotted below).
Now it is reaching resistance as well as bull exhaustion zones to beware.
Liquidity will be thin for the Holiday weekend, so expect large swings.
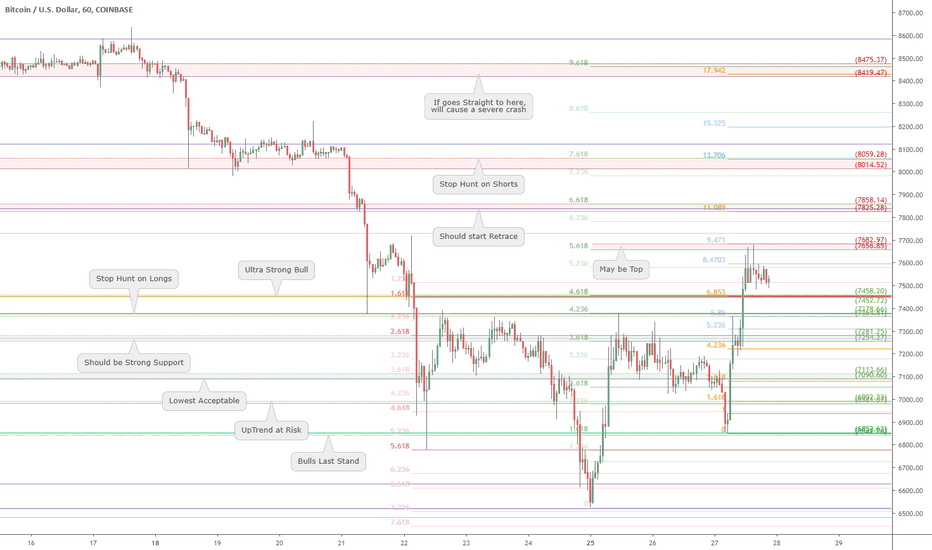
$ 745x.xx has been key figure both on the way up and back down.
Below are several good supports but ideally we do not get there.
Beware that we may have already hit a temporary top at $76xx
.
Part of my ongoing Bitcoin analysis, been hitting every important turn (click):
7650 Resistance Map <= Still in Play
6850 Bounce plot <= Prefect Retrace
5882 critical number <= Remember This
8.7k Top Call
21k possible target (still possible)
9k bounce call (perfect bounce)
12.4k Break
14k > 10k retrace
14k target call <=Perfect TP
10k target call <=6 wks ago
7.5k bounce call <=Perfect Entry
10k path laid out
3.1k bottom call (the EXACT bottom)
Of course, I have had total FAILS on some ideas too, not going to pretend.
But all of my plots show PRECISE entries, TIGHT stops, and EXACT targets.
Precision is the way of the Fib. Almost every turn happens at a Fib Line.
.
BTC got a strong bounce from $6500 and then $6850 (both plotted below).
Now it is reaching resistance as well as bull exhaustion zones to beware.
Liquidity will be thin for the Holiday weekend, so expect large swings.
$ 745x.xx has been key figure both on the way up and back down.
Below are several good supports but ideally we do not get there.
Beware that we may have already hit a temporary top at $76xx
.
Part of my ongoing Bitcoin analysis, been hitting every important turn (click):
7650 Resistance Map <= Still in Play
6850 Bounce plot <= Prefect Retrace
5882 critical number <= Remember This
8.7k Top Call
21k possible target (still possible)
9k bounce call (perfect bounce)
12.4k Break
14k > 10k retrace
14k target call <=Perfect TP
10k target call <=6 wks ago
7.5k bounce call <=Perfect Entry
10k path laid out
3.1k bottom call (the EXACT bottom)
Of course, I have had total FAILS on some ideas too, not going to pretend.
But all of my plots show PRECISE entries, TIGHT stops, and EXACT targets.
Precision is the way of the Fib. Almost every turn happens at a Fib Line.
.
ノート
Just got our First Test of support zone in 7450 area, decent reflection this far .
ノート
Pullback continues, and a new clue in hand.Based on the action around two fib lines, we have a new red zone of interest, shown by textbox in this pic
This is how 'lower highs' propagate, in that this new band will be remembered by traders on next visit, and decisions will be made again at that price range.
.
ノート
Also noteworthy are the reactions around this red 1.236 So it is a matter of building confidence levels in a given fib series, and mentally assigning a "weight" to each fib series.
.
ノート
BTC still contained with the two immediate zones Zoomed in, the New Zone from last update seems to have an effect still
Putting a Fib-Ray on the last push:
Some decent pings, but not perfect.
Will go with it for now, and see if prices notices it more or less as time elapses.
A "good fib" will actually get MORE accurate as price crawls around looking for the lines.
.
ノート
Continuing with Blue Fib ^^ above:Looking at that fib in Isolation:
A good trick to "isolating" something is to use the "Visibility" setting.
In this example I set all my other stuff to visibility of 2 minutes or more, while looking at the 1 minute chart.
Thus I can look at a single drawing within many.
.
ノート
Looks like we may have gotten the Stop Hunt on Longs Zoomed in we see all of the fibs still holding Precisely.
Even though it has been criss crossed several times recently, it should still shows its presence.
Let see if it does hold or not, either way, it will be a clue to use.
If it causes a reaction, then I have more faith in the rest of the red fib lines.
If not, then we give more weight to other fibs.
.
ノート
Another closeup view and analysis, see text notes on chart Add in a Fib-Ray again to the drop
Now zooming out but leaving the new fib,
so, if price comes down that far, we should see a very strong response, as that zone has just been "reinforced" with another fib layer.
If it does NOT create strong bounce then we change our bias to assuming strong bears or weak bulls....
.
ノート
Ping Was pierced before, stopped exactly at the lower bound this time.
Looks like a Make or Break moment here, such exact reactions are often the start of a larger move.....
.
ノート
a Ping and a Pong .
ノート
As expected, we have a significant pullback, initiated by the Exact Reaction at resistance zone Zoomed in with Fib of the pullback
Bulls needs to take advantage of this second Ping.
2.618 extension is always strong (from either direction) so bulls want to stay North of it.
Zooming back out with above Red fib in place
So bulls have a few back stops lined up that should be pretty strong.
But ideally we do NOT get below $ 7450 which is still the primary battle line.
.
ノート
Decent Ping on the 7450 zone .
ノート
Here we are at what "should be strong support" .
ノート
So we had a massive spike up today, But whatever the cause, we are back above 7450 and holding for now.
Bulls need to count this as a blessing, and do they best to hold 7450 again.
.
ノート
There was once a GREEN Fib, joyous and light .....
Then came this mean old RED fib, angry and heavy
...
They were just trying to meet in the middle
...
And their story shalt forever be told here in TV land

the Golden Ratio is my Religion
the Trading View is my Nation
the Moderator Tag is my Flag
the Trading View is my Nation
the Moderator Tag is my Flag
関連の投稿
免責事項
これらの情報および投稿は、TradingViewが提供または承認する金融、投資、取引、またはその他の種類の助言もしくは推奨であることを意図したものではなく、またこれらに該当するものでもありません。詳細は利用規約をご覧ください。
the Golden Ratio is my Religion
the Trading View is my Nation
the Moderator Tag is my Flag
the Trading View is my Nation
the Moderator Tag is my Flag
関連の投稿
免責事項
これらの情報および投稿は、TradingViewが提供または承認する金融、投資、取引、またはその他の種類の助言もしくは推奨であることを意図したものではなく、またこれらに該当するものでもありません。詳細は利用規約をご覧ください。