
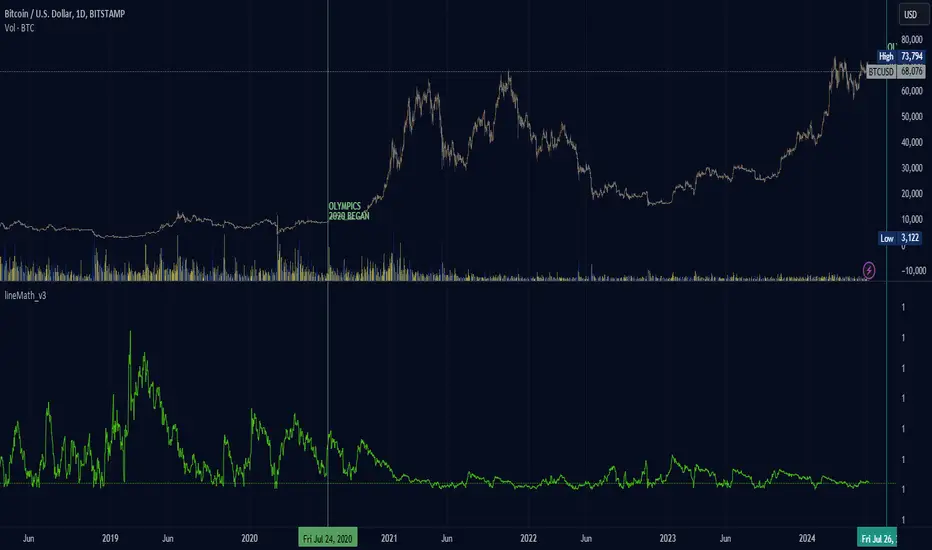
not sure what I created here; the indicator line shows slope information that leads before the price increases in the future. may have something to do with the halving and reduction in BTC. the green line decreases as the price grows in the same way a previous chart prices look smaller as the price reaches higher. the only difference here is that the graph lines are happening before the price of BTC peaks, odd. ...now I have to wait to see if the indicator line changes dramatically ahead of the price of BTC...

免責事項
これらの情報および投稿は、TradingViewが提供または承認する金融、投資、取引、またはその他の種類の助言もしくは推奨であることを意図したものではなく、またこれらに該当するものでもありません。詳細は利用規約をご覧ください。
免責事項
これらの情報および投稿は、TradingViewが提供または承認する金融、投資、取引、またはその他の種類の助言もしくは推奨であることを意図したものではなく、またこれらに該当するものでもありません。詳細は利用規約をご覧ください。