
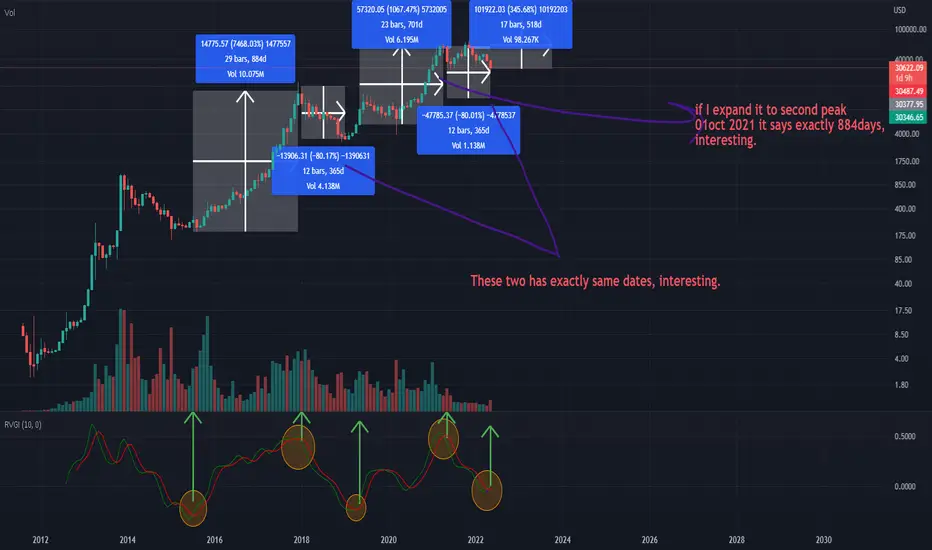
All the ideas are on the chart. You need to know that you should ignore if RVGI crosses in series, it only makes sense if it crosses after not crossing for a long time.
I can see that I ignore a couple of things like we didn't spend all 365 days on bear market after last downside cross of RVGI, actually no explanation for that I just think from 64k to 69k in 7 months is not exactly bull market we just spend a couple of months correction and accumulation then tried to put another ride but the time was not right.
I can see that I ignore a couple of things like we didn't spend all 365 days on bear market after last downside cross of RVGI, actually no explanation for that I just think from 64k to 69k in 7 months is not exactly bull market we just spend a couple of months correction and accumulation then tried to put another ride but the time was not right.

免責事項
これらの情報および投稿は、TradingViewが提供または承認する金融、投資、取引、またはその他の種類の助言もしくは推奨であることを意図したものではなく、またこれらに該当するものでもありません。詳細は利用規約をご覧ください。
免責事項
これらの情報および投稿は、TradingViewが提供または承認する金融、投資、取引、またはその他の種類の助言もしくは推奨であることを意図したものではなく、またこれらに該当するものでもありません。詳細は利用規約をご覧ください。